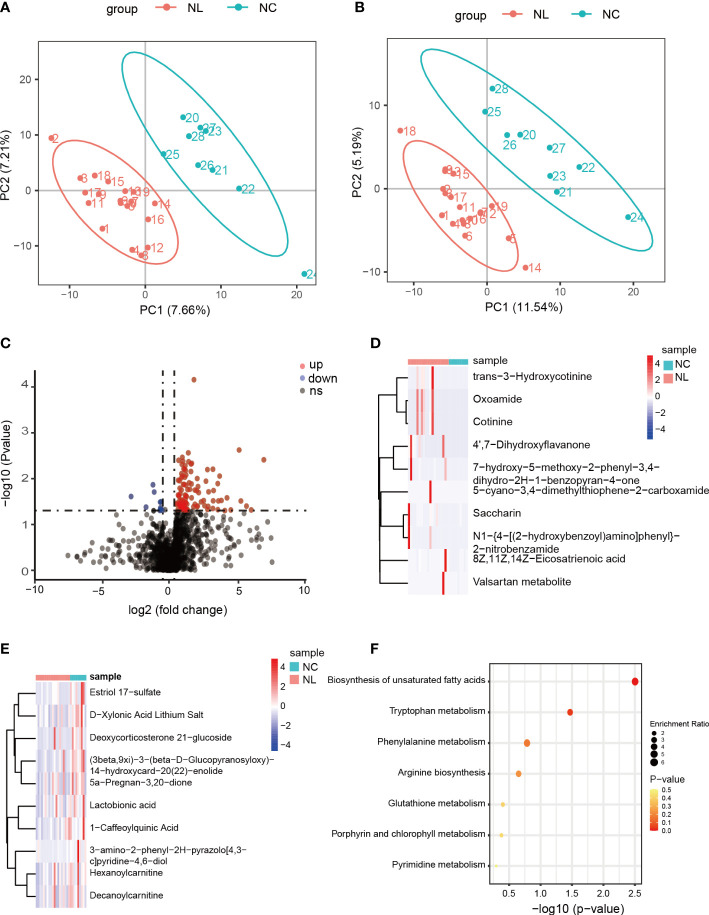
Figure 3.
Differentially expressed metabolites between control individuals and nephrolithiasis patients. (A) Partial least squares discriminant analysis (PLS-DA) of positively charged metabolites. (B) PLS-DA of negatively charged metabolites. (C) Volcano plot of differentially expressed metabolites (DEMs), characterized by fold change ≥ 1.2 or ≤ 0.667 (P < 0.05) with a threshold of VIP ≥ 1. Red dots represent up-regulated metabolites, blue dots represent down-regulated metabolites. (D) Heatmap of top 10 up-regulated metabolites in nephrolith patients. (E) Heatmap of top ten down-regulated metabolites in nephrolith patients. (F) KEGG enrichment analysis of the DEMs.

