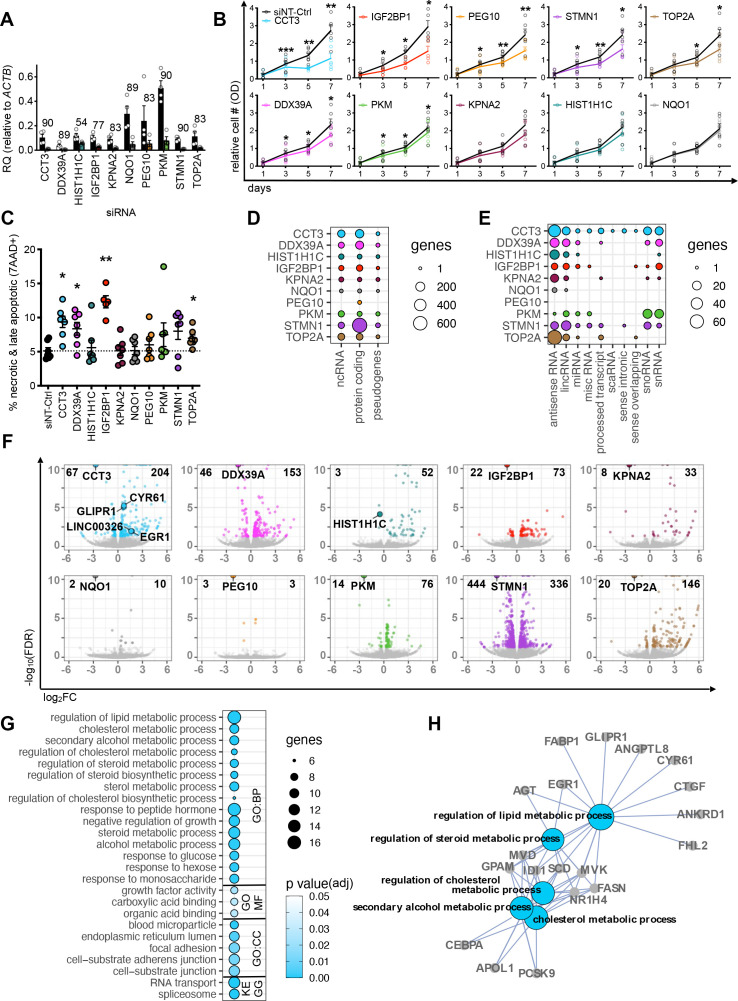
Figure 2.
Reduced expression of RBP genes impact various cellular and molecular responses in HCC cell lines. (A) Bar graph displays RBP gene expression levels before (black bars) and after siRNA-mediated RBP-KD (coloured bar) relative to ACTB in HepG2 and Huh7 cells determined by qPCR (n=4 mean, ±SEM). Number above each bar shows the average KD efficiency in percent. Colour code: CCT3 (blue), DDX39A (magenta), HIST1H1C (turquoise), IGF2BP1 (red), KPNA2 (plum), NQO1 (grey), PEG10 (yellow), PKM (green), STMN1 (purple) and TOP2A (brown). Individual replicates are displayed by white circles. (B) Line graphs show the relative number of metabolically active cells (measured by optical density) over 7 days after siRNA-mediated RBP-KDs assayed by the MTT assay (n=5). Black line: non-targeting siRNA control (siNT-Ctrl), coloured line: RBP-specific siRNA KD. (C) Dot plot represents the percentage of dead cells after siRNA-mediated RBP-KDs (colour-coded) after 5 days (n=7, mean, ±SEM). (B, C) Statistics: paired two-tailed t-test, *p<0.05, **p<0.01, ***p<0.001. (D, E) Circle plots display number of genes per RNA biotype affected by RBP-KDs. The diameter of the circles corresponds to the number of genes in each category. Deregulated genes falling into different ncRNA subcategories are shown in figure 2E.(F) Volcano plots demonstrate DE genes after RBP-KDs. Data points represent significantly DE genes (colour-coded by RBP-KD, FDR<0.05) and not significantly DE genes (grey, FDR>0.05). Bolded numbers on the top of each graph indicate total number of DE genes (FDR<0.05). The wider circle in each plot highlights the downregulated RBP. Genes with an FDR value smaller than 1 × 10⁻¹⁰ were collapsed at 1 × 10⁻¹⁰. (G) Circle plot shows GO term and KEGG pathway enrichment analysis of deregulated genes after the CCT3-KD (FDR<0.05). The diameter of the circles corresponds to the number of genes in each GO or KEGG term and the colour code represents varying degrees of significance (white: high and blue: low p value). (H) Interaction network displays connections of the five most significant GO BP terms in figure 2G. GO term is bolded and gene names are highlighted. BP, biological process; CC, cellular compartment; DE, differentially expressed; KD, knockdown; MF, molecular function; OD, optical density; RQ, relative quantity.

