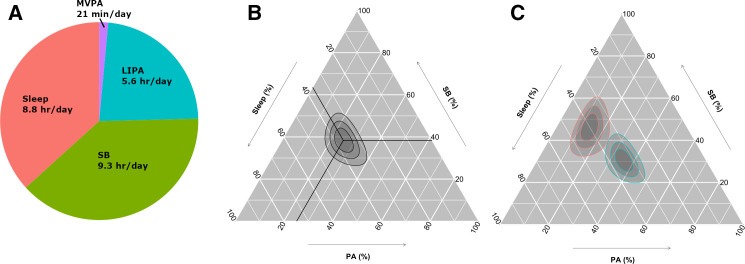
Figure 2.
Distribution of movement behaviours in 87 498 UK Biobank participants. (A) Mean movement behaviour composition among UK Biobank participants. (B) Movement behaviours of UK Biobank participants on a ternary plot, showing sleep, sedentary behaviour (SB) and physical activity behaviours (PA; combines light and moderate-to-vigorous physical activity behaviours). The crosshair marks the compositional mean. Concentric rings represent the 25, 50% and 75% prediction regions for the data. The behaviour composition at a point can be found by tracing out (parallel to the white lines and crosshair) from the point to the axes. (C) Ternary plot showing the behaviour distribution of the 5% most active (blue) and 5% least active (red) UK Biobank participants by average acceleration. Concentric rings represent the 25, 50% and 75% prediction regions for each group. LIPA, light physical activity behaviours; MVPA, moderate-to-vigorous physical activity behaviours.

