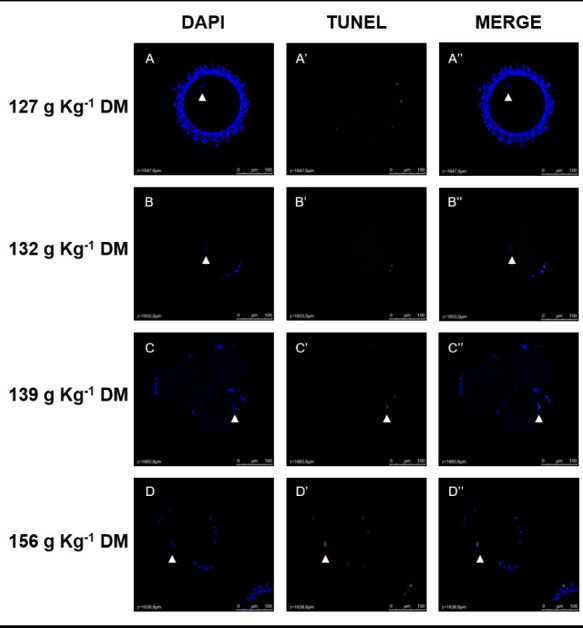
Figure 1. Representative images of oocytes nuclei (white arrow head) stained with DAPI (blue) and TUNEL (green) from the treatments 127g Kg-1 DM (A), 132 g Kg-1 DM (B), 139 g Kg-1 DM (C) and 156 g Kg-1 DM (D). Figures are a z-stack image showing the region of oocyte nuclei of COC for each group. Confocal fluorescence microscopy, 400 x magnification.

