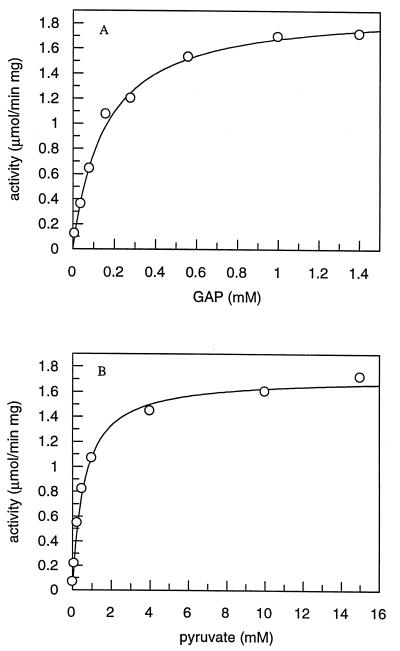
FIG. 7.
Substrate saturation curves for DXPase-A determined in the presence of a fixed concentration of the second substrate utilizing a coupled enzyme assay. GAP is generated in situ by utilizing a coupled enzyme assay starting with dihydroxyacetone phosphate. (A) Different concentrations of GAP (0.03 to 1.0 mM) and 5 mM [2-14C]pyruvate (0.10 to 7.9 μCi/μmol). (B) Different concentrations of [2-14C]pyruvate (0.025 to 15 mM) and 1.2 mM GAP. The assay mixtures contained 2 mM MgCl2, 15 U of TIM, and 3 μg of DXPase-A, and the reactions were quenched by heating at 80°C and treated with SAP as described in Materials and Methods. The initial velocities were determined from the slope of a plot of time versus product for each concentration of GAP and pyruvate (data not shown).

