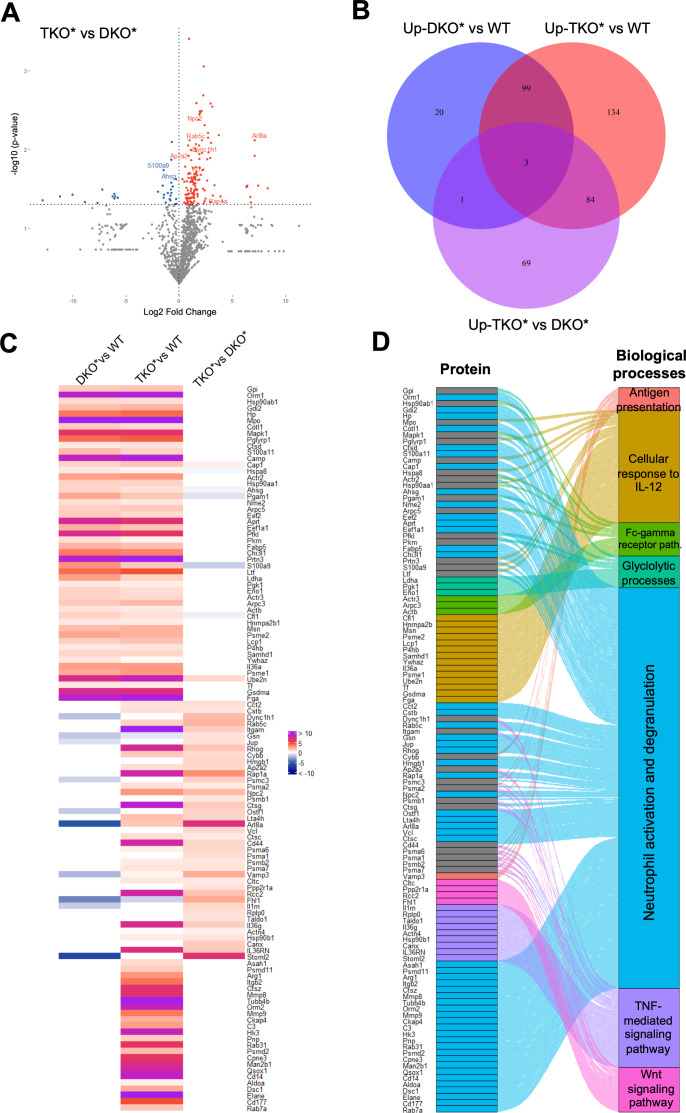
Figure 4.
Proteomic analyses in whole ear extracts of DKO* and TKO* mice. (A) Volcano plot showing upregulated (red) and downregulated (blue) proteins (n=3–5 per condition; p<0.05); proteins in grey are below statistical significance. (B) Venn diagram depicting statistically significant upregulated proteins in (I) mice with inducible dual epidermal deletion of c-Jun and junB (DKO*) compared towild-type (WT) controls, (II) mice with triple epidermal deletion of c-Jun, JunB and S100A9 (TKO*) compared toWT mice and (III) TKO* compared to DKO* mice (n=3–5 per condition; p<0.05). (C) Heat map of significantly upregulated proteins (left) and Alluvial plot (right) of enriched biological processes associated to each protein.

