
FIGURE 2.
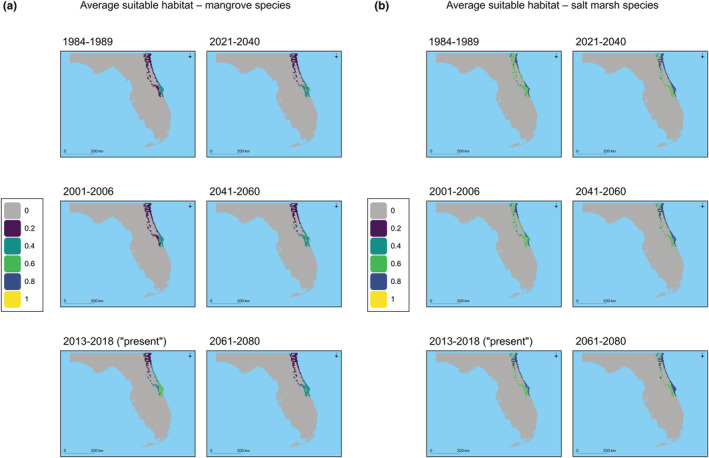
For the NE Florida validation region, the projected suitable habitat is shown for the two past hindcast‐validation time periods, as well as the present, and for three future time periods. The average mangrove suitable habitat is shown in (a) and average salt marsh suitable habitat is shown in (b). For each plot the average suitable habitat is shown in Table 2.