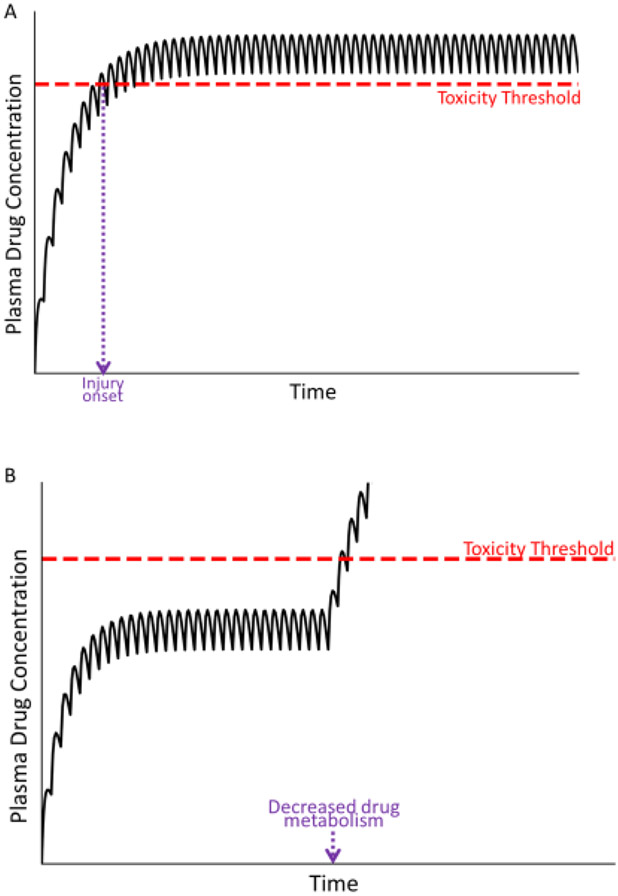
Figure 4. Plasma drug concentration over time under conditions in which the drug concentration exceeds the toxicity threshold.
Panel A represents a situation in which the patient’s metabolism or transport capabilities are compromised before the start of therapy; in this case, the plasma drug concentration can exceed the threshold for toxicity, resulting in an early onset of injury (violet dashed line). Panel B represents a decrease in the patient’s drug metabolism or exretion during maintenance therapy. In this case, plasma drug concentration rises and has the potential to exceed the toxicity threshold. A new, elevated steady state plasma concentration will ultimately be established (not shown).

