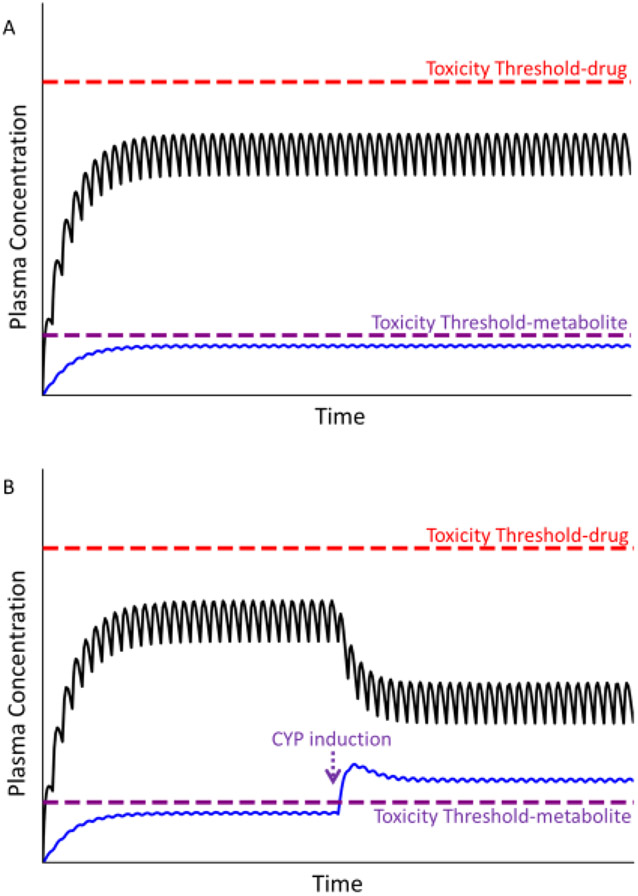
Figure 5. Plasma concentration of parent drug and its metabolite over time.
Toxicity thresholds are shown for both parent compound (red dashed line) and metabolite (violet dashed line). Panel A represents the desired therapeutic condition in which the plasma concentration of parent drug as well as its metabolite(s) (blue line) remain below their respective toxicity thresholds. Panel B represents the condition in which the concentration of the metabolite exceeds its toxicity threshold, in this case due to induction of CYP during maintenance therapy, prompting an adverse reaction.

