
Figure 3. Sex hormone levels before and after CUMS model establishment in the control group and in chronic stressed group both in male and in female mice.
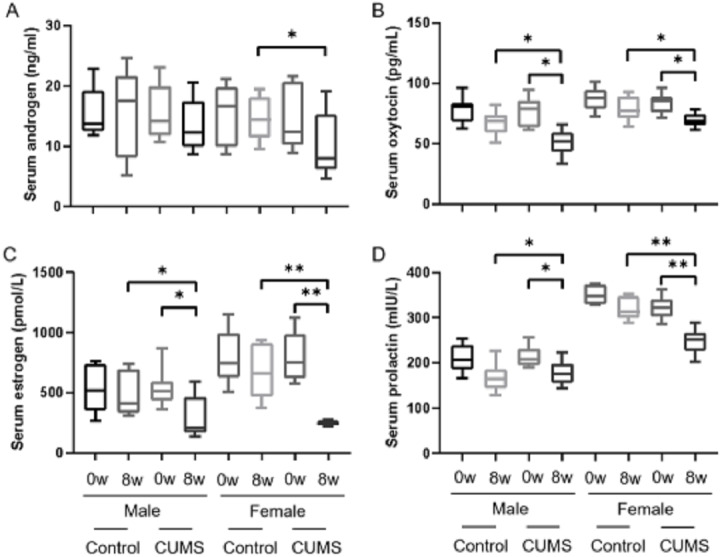
Sex hormone levels before and after CUMS model establishment in different group. (A) Serum androgen concentration, n = 10; (B) serum oxytocin concentration, n = 10; (C) serum estrogen concentration, n = 10; (D) serum prolactin concentration, n = 10. ∗p < 0.05, ∗∗p < 0.001.