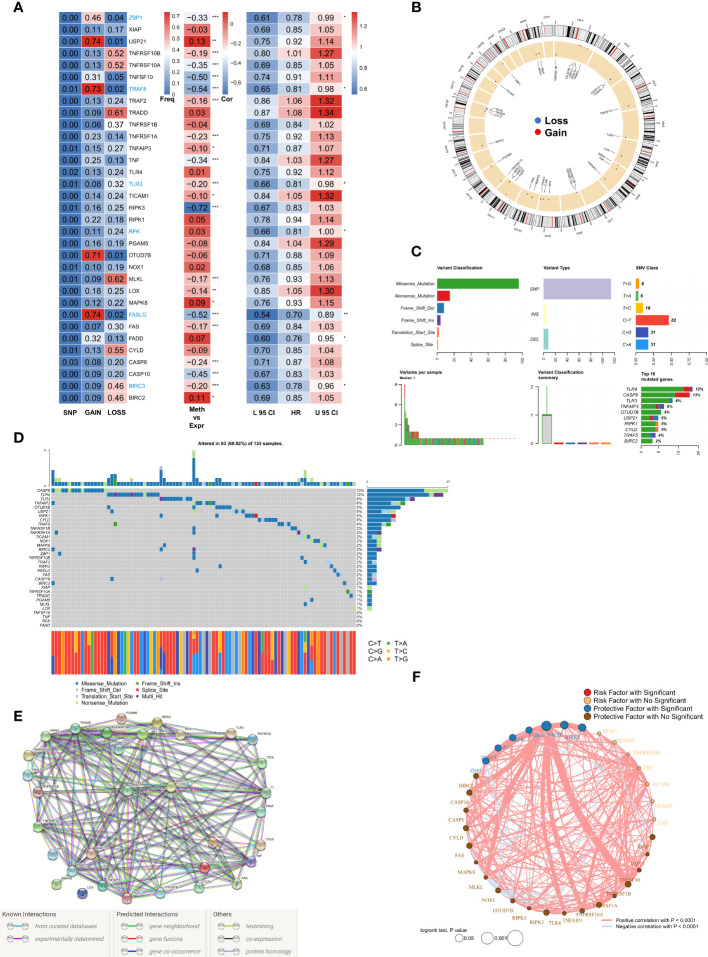
Figure 1.
Genomic mapping for NRGs in BRCA (A). Heat map showing genomic changes and hazard ratios of NRGs in TCGA-BRCA cohort; from left to right: correlation between mutation and CNV frequencies of NRGs, modifications in DNA methylation and expression of NRGs, and a univariate Cox regression analysis showing risk ratios for NRGs; *p < 0.05, **p < 0.01, ***p < 0.001; (B). Circle plot demonstrating CNV events in NRGs on the chromosomes; (C). Summary of CNV events in NRGs in TCGA-BRCA cohort; (D). Oncoplot showing the mutational map of NRGs; (E). PPI network of NRGs based on STRING; (F). Correlation network of NRGs.

