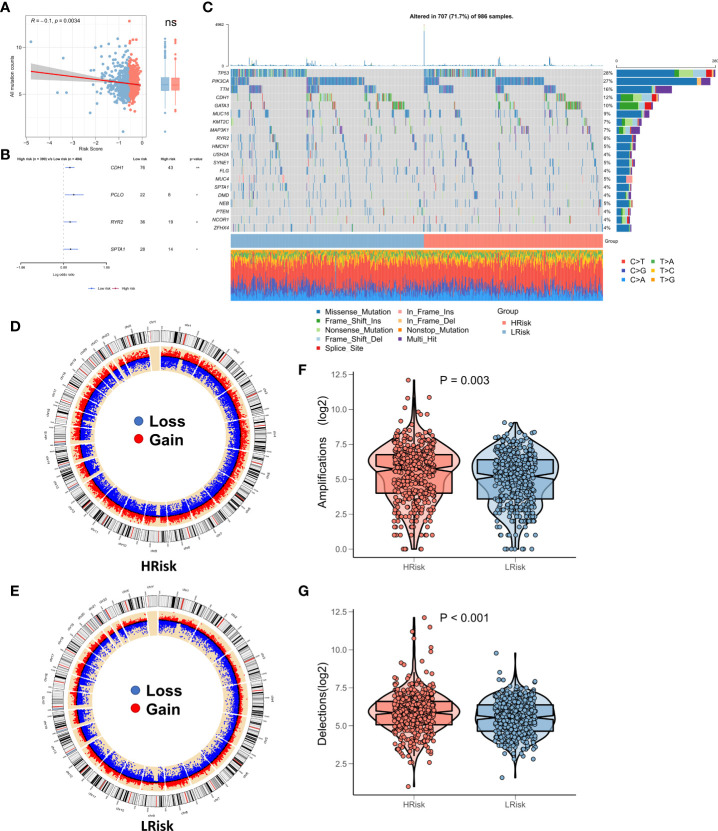
Figure 6.
Landscape of genomic variations for the NRG-related risk model (A). Correlation between RiskScore and TMB; (B). Forest plot showing genes with significant differences in mutations between the high-risk and low-risk groups; (C). Oncoplot showing the significantly mutated genes between the high-risk and low-risk groups; (D). Circle plot showing the CNV landscape in the high-risk group; (E). Circle plot showing the CNV landscape in the low-risk group; (F). Box plot showing the differences in the number of chromosomal deletions between the high-risk and low-risk groups; (G). Box plots showing the differences in the number of chromosome amplifications between the high-risk and low-risk groups *p < 0.05; **p < 0.01. ns, p > 0.05.

