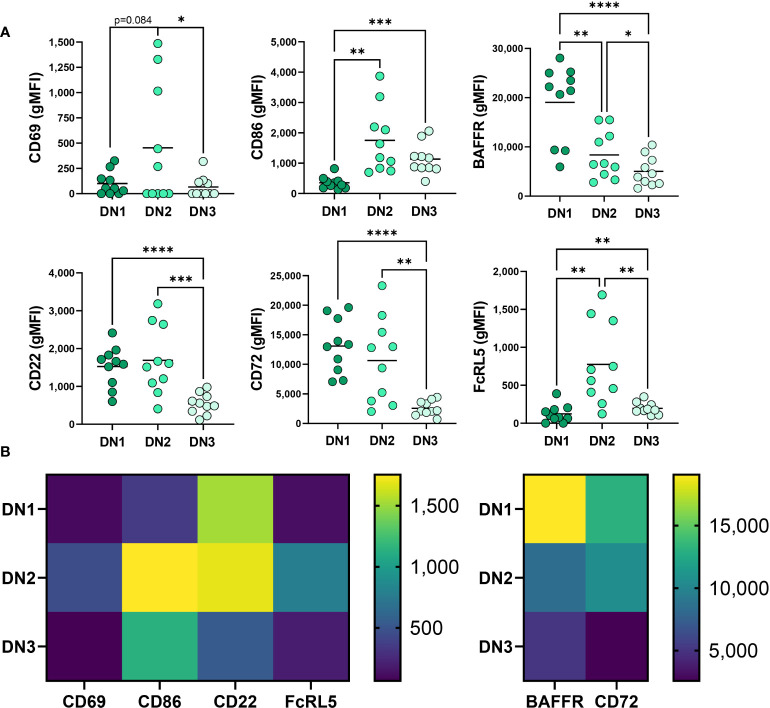
Figure 2.
Phenotypic comparison of DN1, DN2 and DN3 cells in healthy controls. (A) Quantification of expression level (gMFI: geometric mean fluorescent intensity) of CD69, CD86, BAFFR, CD22, CD72 and FcRL5 on DN1, DN2 or DN3 cells from healthy controls (N=10) and (B) a heatmap visualizing the differences between DN1, DN2 and DN3 subsets of average gMFI values. Statistics: one-way ANOVA, *p < 0.05, **p < 0.01, ***p < 0.001, ****p < 0.0001.

