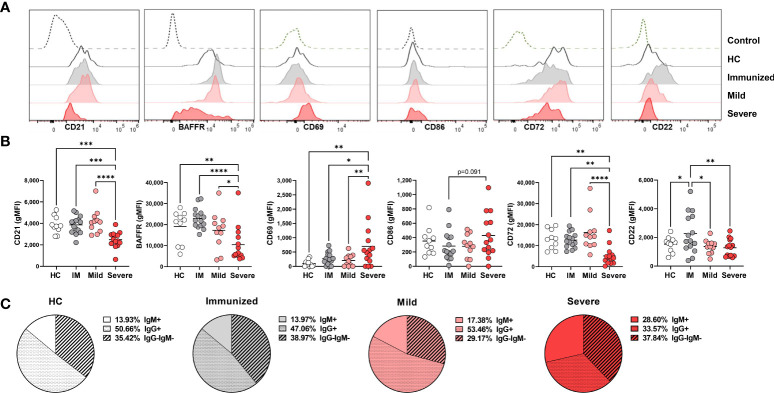
Figure 3.
Phenotypic changes in DN1 cells with Severe SARS-CoV-2 infection. (A) Representative histograms depicting expression of CD21, BAFFR CD69, CD86, CD72, and CD22 on DN1 cells from a healthy control (HC), an individual immunized against SARS-CoV-2 or with mild or severe SARS-CoV-2 infection. Control dotted histogram is an FMO for CD69, CD68, CD72 and CD22. Control dotted histogram for BAFFR and CD21 is expression on CD3+ T cells from a healthy control subject. (B) Quantification of CD21, BAFFR, CD69, CD86, CD72, and CD22 expression (gMFI: geometric mean fluorescent intensity) on DN1 cells from healthy controls (HC), individuals immunized against SARS-CoV-2 (IM), or with mild or severe SARS-CoV-2 infection. (C) Pie charts depicting the average frequency of IgM+, IgG+, or IgG-IgM- DN1 cells for healthy controls (HC, N=10), individuals immunized against SARS-CoV-2 (N=15), or with mild (N=11) or severe SARS-CoV-2 infection (N=14). Statistics: one-way ANOVA, *p < 0.05, **p < 0.01, ***p < 0.001, ****p < 0.0001.

