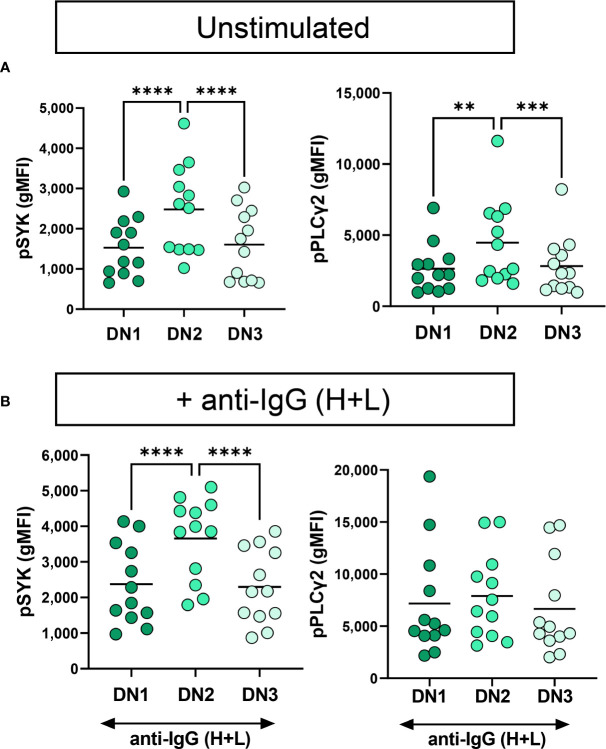
Figure 7.
Functional comparison of DN1, DN2 and DN3 cells in severe SARS-CoV-2 infection. (A) Quantification of expression level of pSYK or pPLCγ2 on DN1, DN2 or DN3 cells from individuals with severe SARS-CoV-2 infection (N=12) without (unstimulated) or (B) with stimulation by 10μg/mL anti-IgG (H+L) F(ab’)2 for 5 min. Statistics. one-way ANOVA, **p < 0.01, ***p < 0.001, ****p < 0.0001.

