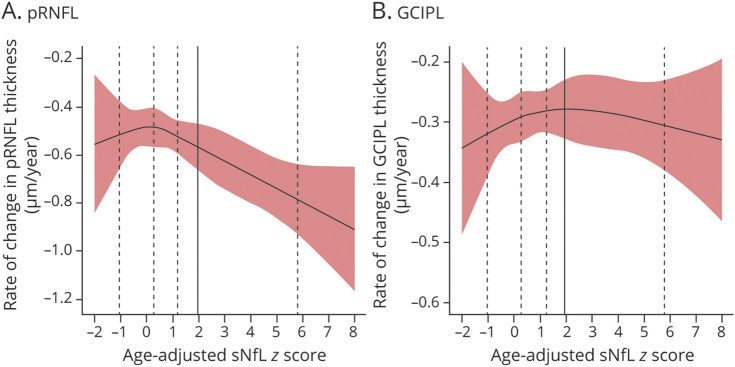
Figure 2. Relationship of Annualized Rate of Change in pRNFL and GCIPL Thickness With Age-Adjusted sNfL Z-Scores in MS Participants.
Relationships of the estimated annualized rates of change in pRNFL (A) and GCIPL (B) thickness with age-adjusted sNfL Z-scores in participants with MS are shown. The bounds of the shaded areas correspond to the 95% CIs of the estimated annualized rates of change. The adjusted sNfL Z-scores were derived using the healthy control data and modeled using restricted cubic splines (the vertical dashed lines correspond to the knot placement at the 5th, 35th, 65th and 95th percentiles of the sNfL Z-score distribution in the participants with MS; the vertical solid line corresponds to the 97.5th percentile cutoff [derived from the distribution in the healthy controls] for sNfL-E vs sNfL-N). GCIPL: ganglion cell + inner plexiform layer; MS = multiple sclerosis; pRNFL: peripapillary retinal nerve fiber layer; sNfL = serum neurofilament light chain; sNfL-E = elevated sNfL; sNfL-N = normal sNfL.

