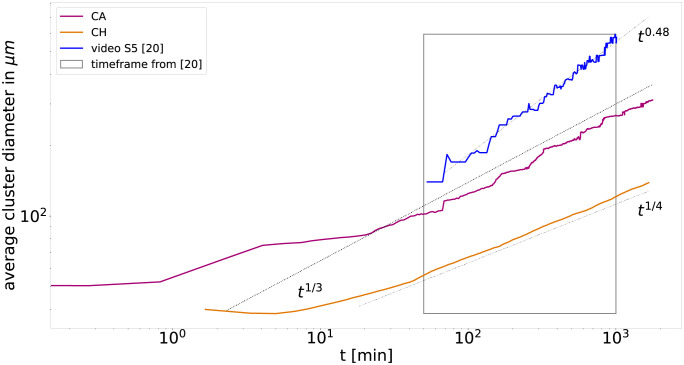
Fig 5. Exemplary comparison of the average cluster diameter in the segregation of PFK and EPC for the cellular automaton model (red line), the Cahn-Hilliard model (orange line) and the experimental data (blue line, based analysis of video S5 of Méhes et al. [20]) computed with two-point correlation method, see Materials and methods.
Note that average cluster diameter in both models, cellular automaton and Cahn-Hilliard, are inverse proportional to their segregation indices. In contrast, the average cluster diameter obtained for the experimental data displays a steeper power law than expected from the corresponding segregation indices.

