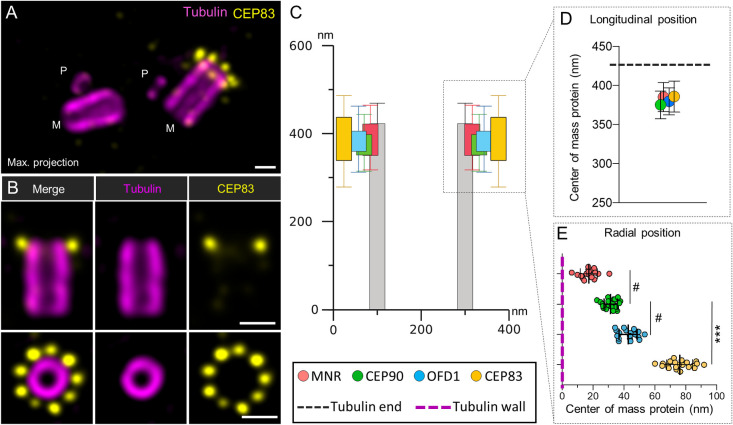
Fig 7. U-ExM localization of CEP83.
(A, B) U2OS cells were expanded using the U-ExM technique and stained for tubulin (magenta) and CEP83 (yellow). Maximum intensity projection shows the organization of CEP83, which is only present at the distal end of one of the 2 mature centrioles and not at the level of the procentriole (M: Mature centriole; P: Procentriole) (A). Single plan images show that CEP83 localizes slightly underneath the distal end of both the mature centriole and is organized in a 9-fold symmetry (B). Scale bars = 200 nm. (C, D) Distance between the proximal part of centriole (tubulin) and the fluorescence center of mass of CEP90 (green), OFD1 (cyan), MNR (orange), or CEP83 (yellow) (longitudinal position). N = 23, 25, 49, and 28 centrioles for CEP90, OFD1, MNR, and CEP83, respectively, from 3 independent experiments. Average +/− SD: CEP90 = 375.3 +/− 17.8 nm, OFD1 = 381.4 +/− 17.4 nm, MNR = 385.1 +/− 18.7 nm, CEP83 = 386.7 +/− 19.9 nm. (C, E) Localization of CEP90, OFD1, MNR, and CEP83 with respect to the microtubule wall (radial position). N = 21, 18, 17, and 21 centrioles for CEP90, OFD1, MNR, and CEP83, respectively, from 3 independent experiments. Average +/− SD: MNR = 17.4.1 +/− 5.5; CEP90 = 31.4 +/− 4.3 nm, OFD1 = 42.7 +/− 5.9 nm, CEP83 = 76.0 +/− 8.3 nm. Statistical significance was assessed by Kruskal–Wallis test followed by Dunn’s post hoc test, CEP90 vs. MNR p = 0.06 (#), CEP90 vs. OFD1 p = 0.07 (#), CEP90 vs. CEP83 p < 0.0001. Source data can be found in S5 Data. MNR, Moonraker; U-ExM, ultrastructure expansion microscopy.

