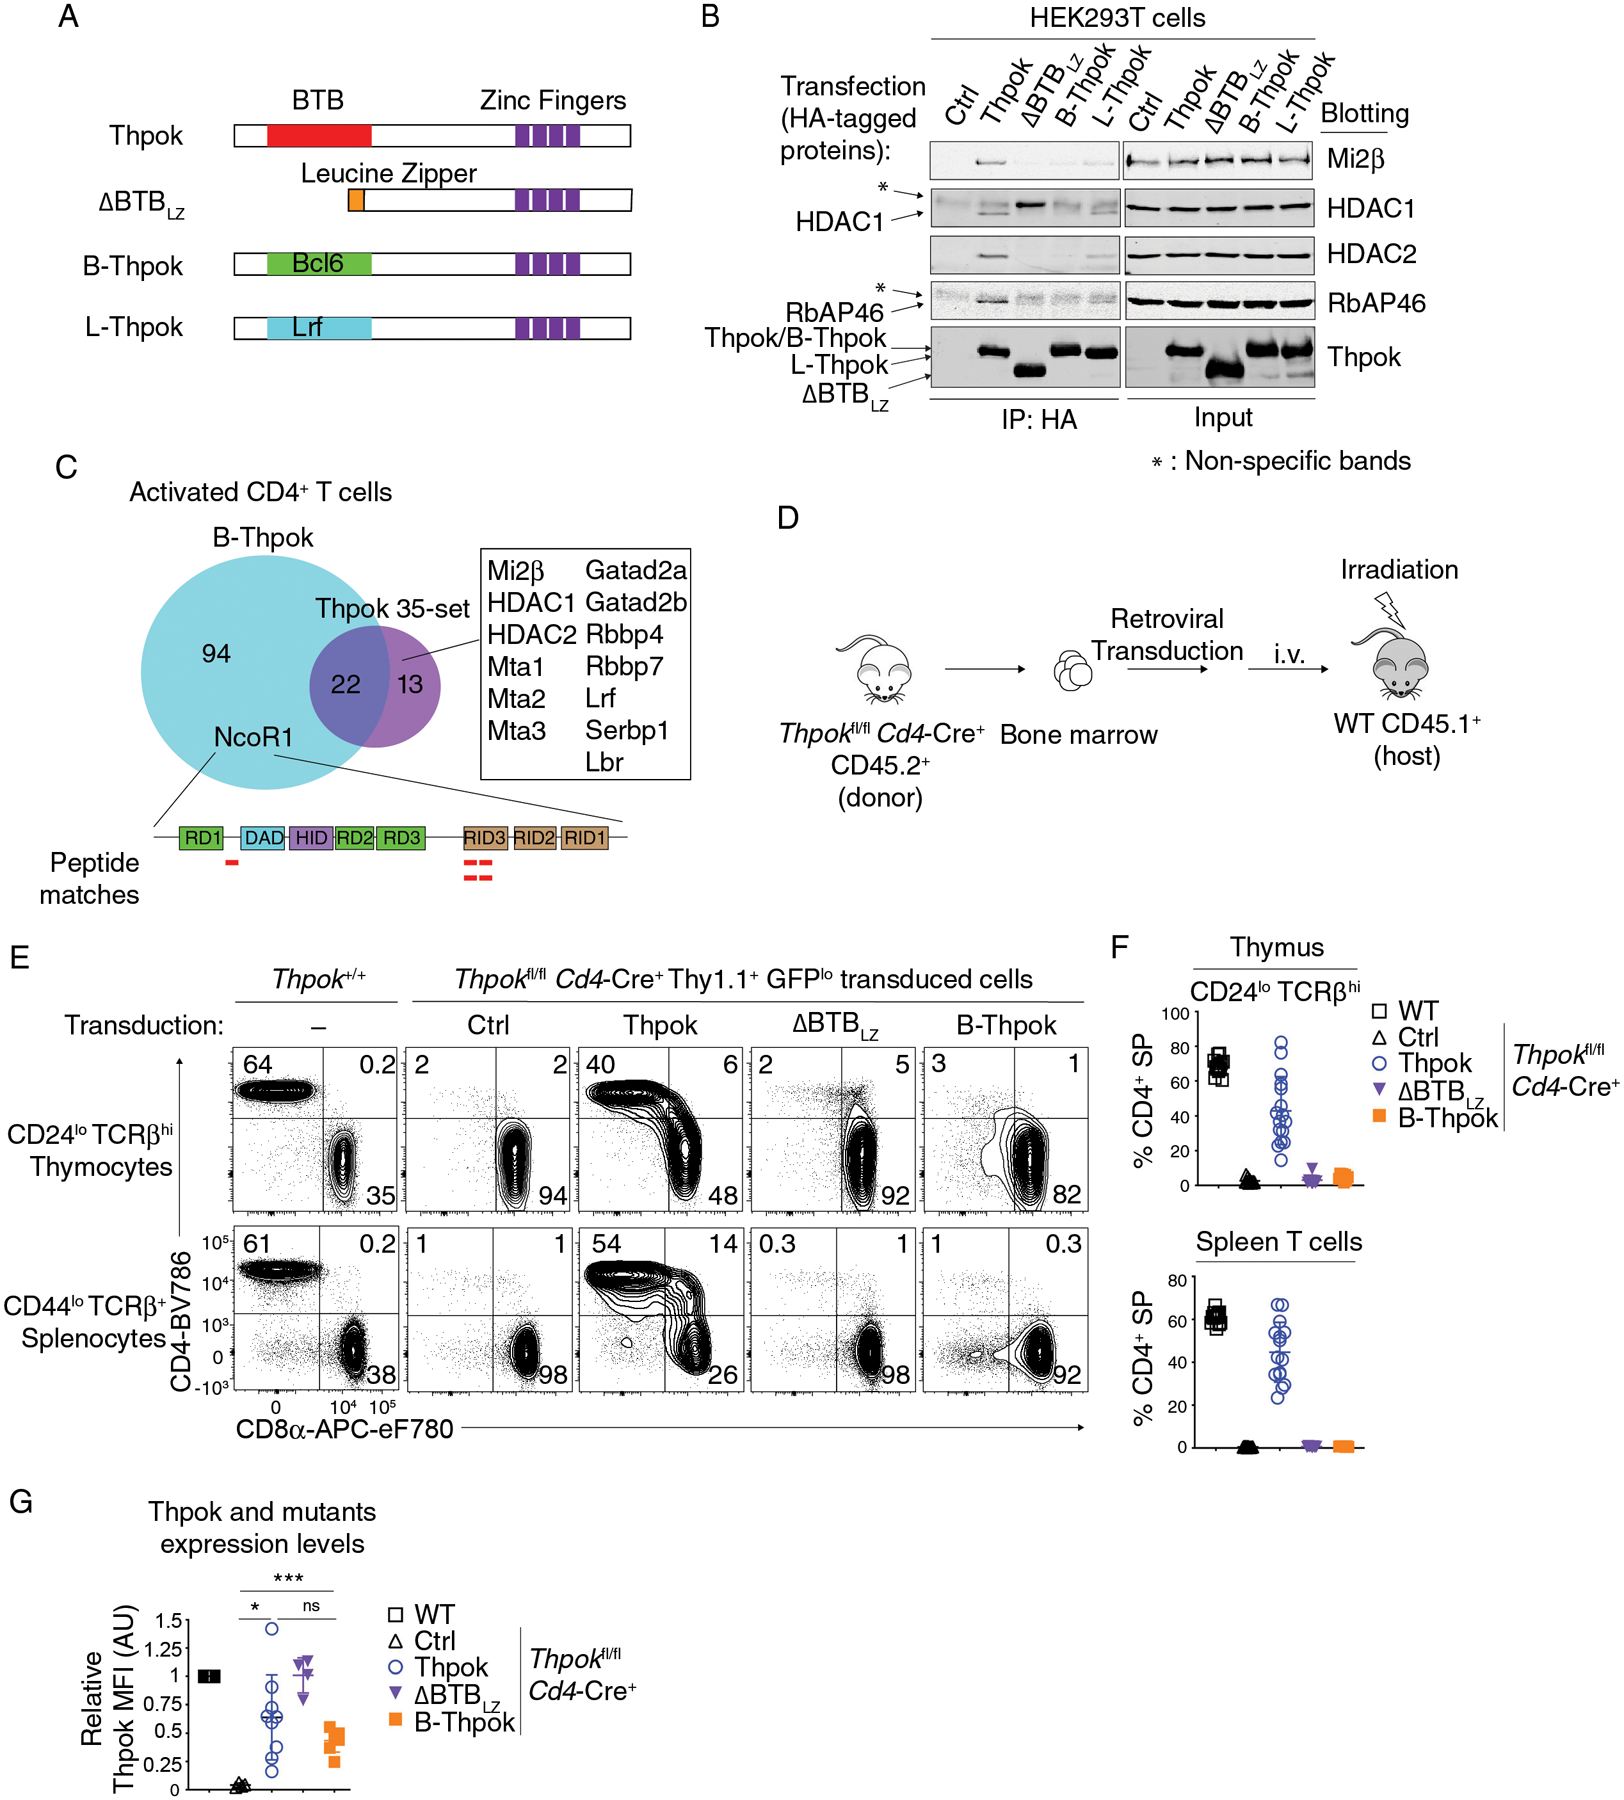
Figure 4. Functional specificity of BTB domains.

(A) Schematic diagram of Thpok and chimeric constructs. The Thpok BTB domain and zinc finger motifs are depicted by red and purple boxes; the Leucine Zipper sequence (LZ) by the orange box. The Bcl6 and Lrf BTB domain are depicted by green and cyan box, respectively.
(B) Immunoblot analysis of anti-HA immunoprecipitates (left panel) or whole cell lysates (right panel) from HEK293T cells transfected with control vector (pcDNA3, Ctrl), HA-tagged Thpok, ΔBTBLZ, B-Thpok or L-Thpok. Protein blots were probed with antibodies as indicated. * indicates non-specific bands. Data are representative of more than three independent experiments.
(C) Venn diagram showing B-Thpok binding partners and Thpok 35-set as detected by mass spectrometry after streptavidin pull down in activated CD4+ T cells. Proteins binding Thpok but not B-Thpok are listed in the box. Peptides from NCoR1 detected in the B-Thpok pull-down are depicted by red lines along the NCoR1 schematic (bottom). RD1–3: Repression Domain; DAD: Deacetylase Activity Domain; HID: Histone Interaction Domain; RID: Receptor Interacting Domain.
(D) Schematic diagram of retrogenic mice generation.
(E) Expression of CD4 and CD8 in indicated thymocyte and splenocyte subsets from retrogenic mice generated with Ctrl (empty pPMGfIT vector), or Thpok-, ΔBTBLZ- or B-Thpok-expressing pPMGfIT retroviruses. The contour plots are representative of three independent experiments totaling n= 13 (WT, C57BL/6 mice), 12 (Ctrl), 16 (Thpok), 9 (ΔBTBLZ) or 8 (B-Thpok) retrogenic mice.
(F) The percentages of CD4+ SP cells in CD44lo CD24lo TCRβhi thymocytes (top) and in CD44lo TCRβ+ splenocytes (bottom) in mice shown in (E).
(G) Flow cytometric expression of transduced Thpok, ΔBTBLZ and B-Thpok in CD4+ CD8int TCRβhi CD69+ thymocytes, expressed relative to that of Thpok-expressing CD4+ CD8int TCRβhi CD69+ in WT mice, set as 1 in each experiment. The data are summarized from two independent experiments totaling n= 8 (WT), 4 (Ctrl), 9 (Thpok), 4 (ΔBTBLZ) or 7 (B-Thpok) retrogenic mice. Two-way ANOVA *p<0.05, ***p<0.001, ns: p>0.05. Error bars indicate standard deviation.
