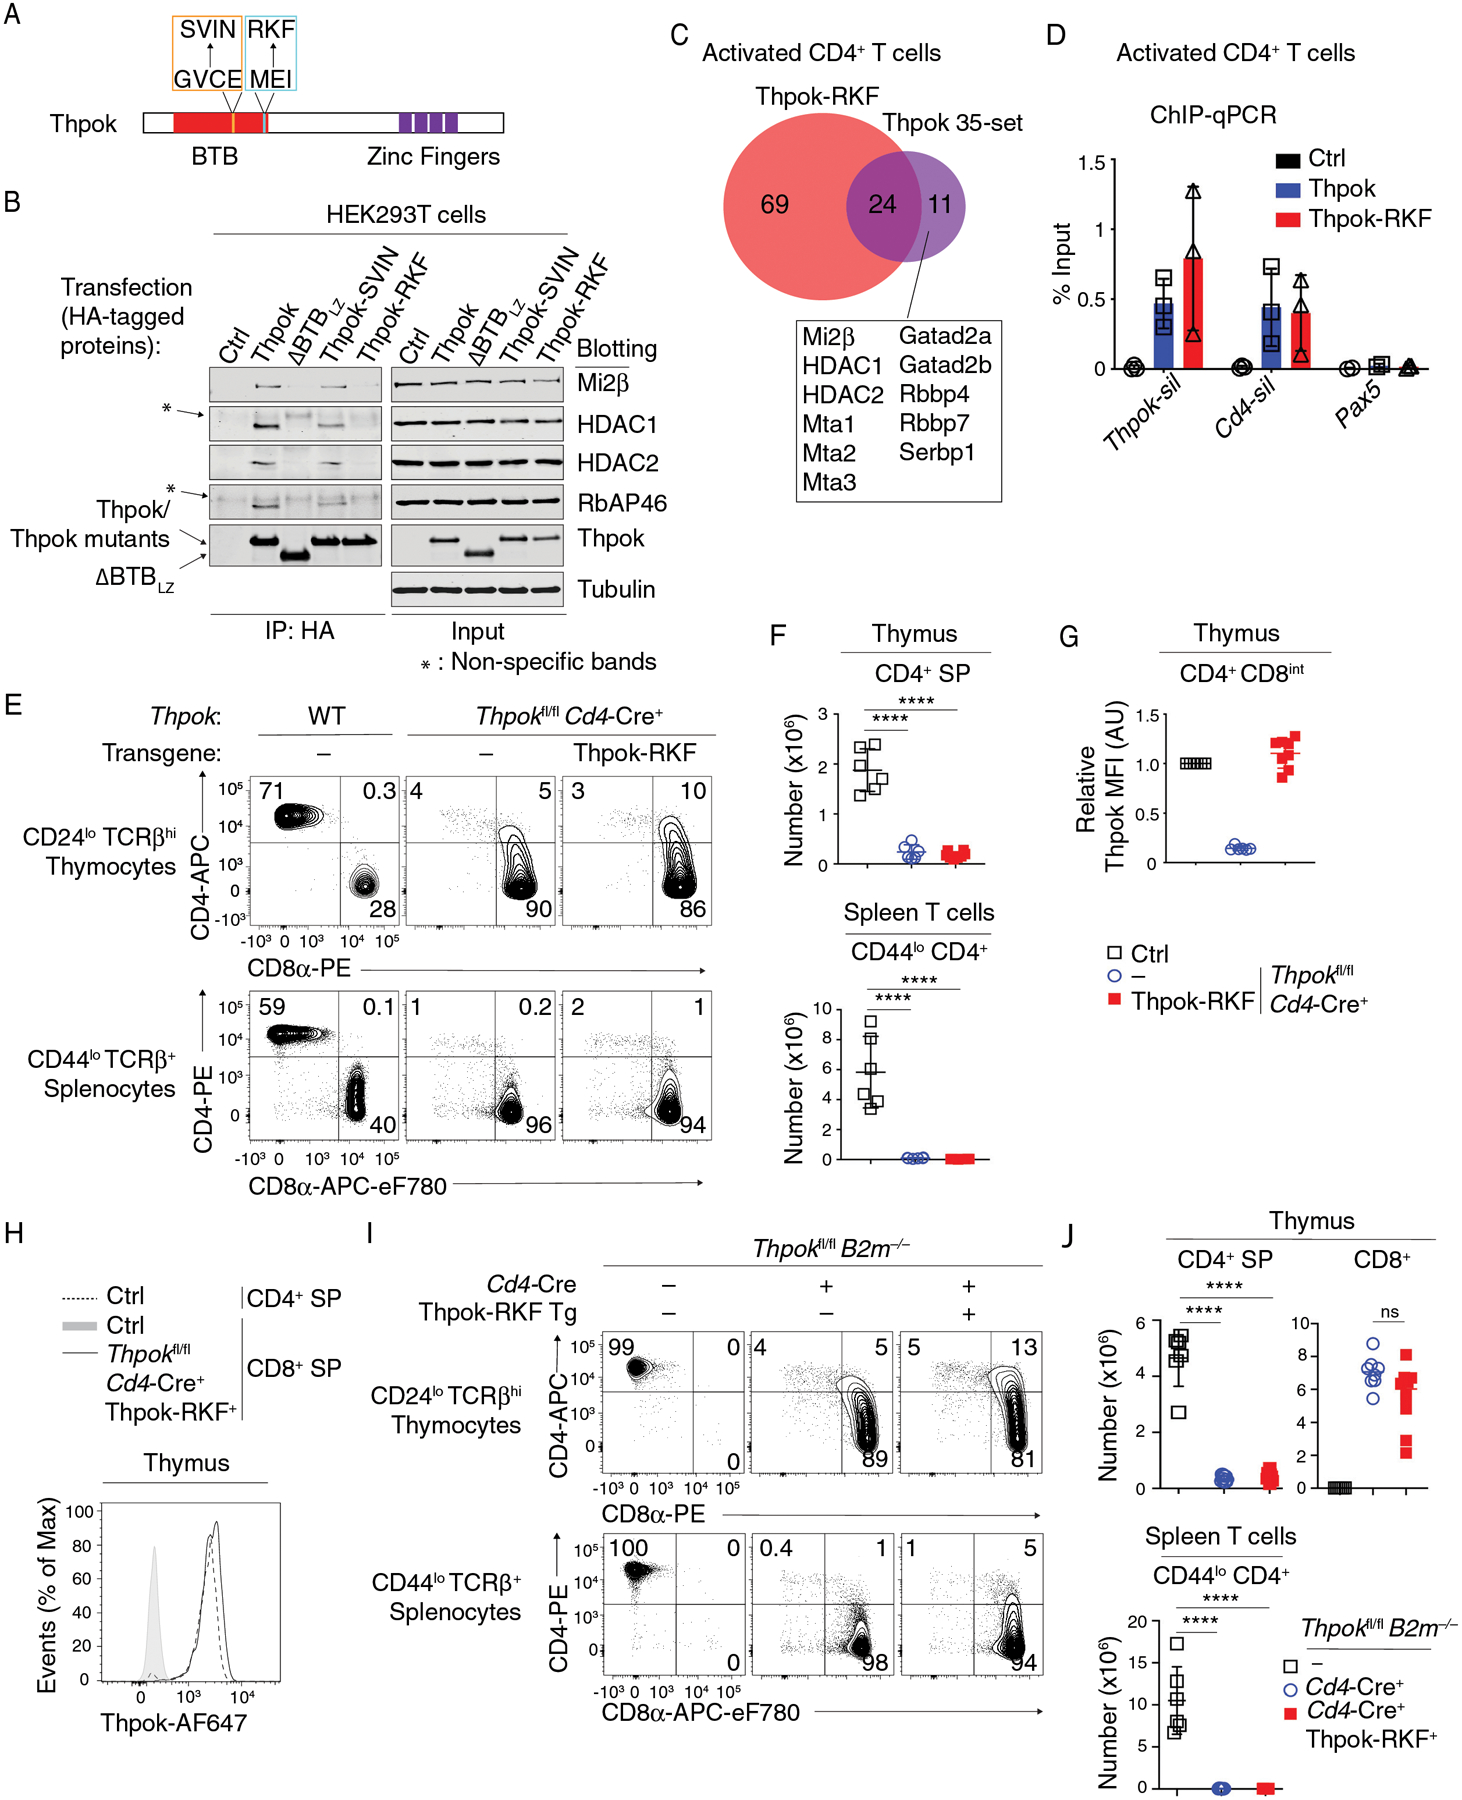
Figure 5. A NuRD-interacting segment of the Thpok BTB domain is needed for CD4 T cell development.

(A) Schematic diagram of Thpok-SVIN (orange line box) and Thpok-RKF (cyan line box) mutations.
(B) Immunoblot analysis of anti-HA immunoprecipitates (left) or whole cell lysates (right) from HEK293T cells transfected with control vector (pcDNA3, Ctrl), HA-tagged Thpok, ΔBTBLZ, Thpok-SVIN or Thpok-RKF. Protein blots were probed with antibodies as indicated. * indicates non-specific bands. Data are representative of three independent experiments.
(C) Venn diagram showing Thpok-RKF binding partners and Thpok 35-set as detected by mass spectrometry after streptavidin pull down in activated CD4+ T cells. Proteins binding Thpok but not Thpok-RKF complex are listed in the box.
(D) ChIP-qPCR was performed on Thpok and Cd4 silencer elements, and on a region of Pax5 (negative control), from in vitro activated CD4+ T cells from Thpokfl/fl Ox40-Cre+ Rosa26BirA+ that had been retrovirally transduced with empty pMRx (Ctrl), or pMRx expressing Thpok-Bio or Thpok-RKF-Bio. Data are expressed as percent of input DNA. Each symbol represents a separate determination, and the figure summarizes three independent experiments.
(E) Expression of CD4 and CD8 in indicated thymocyte and splenocyte subsets from indicated mice.
(F) Numbers of CD44lo CD24lo TCRβhi CD4+ SP thymocytes (top) and of CD44lo TCRβ+ CD4+ splenocytes (bottom) in mice shown in (E).
(G) Flow cytometric expression of transgenic Thpok-RKF in CD4+ CD8int TCRβhi CD69+ thymocytes, shown relative to that of Thpok-expressing CD4+ CD8int TCRβhi CD69+ in Thpokfl/fl Cd4-Cre− littermates (Ctrl), set as 1 in each experiment.
(H) Overlaid histograms show expression of transgenic Thpok-RKF in CD24lo TCRβhi CD4− CD8+ thymocytes from Thpokfl/fl Cd4-Cre+ Thpok-RKF+ mice (plain line) and of endogenous Thpok in CD4+ or CD8+ SP thymocytes from Thpokfl/fl Cd4-Cre− (Ctrl) littermates (dotted line and grey-shaded trace, respectively).
Data (E-H) are representative of three independent experiments totaling n= 6 (Thpokfl/fl Cd4-Cre− littermates), 6 (Thpokfl/fl Cd4-Cre+) or 8 (Thpokfl/fl Cd4-Cre+ Thpok-RKF+) mice. One-way ANOVA followed with Tukey multiple comparison tests ****p<0.0001. Error bars indicate standard deviation.
(I) Expression of CD4 and CD8 in indicated thymocyte and splenocyte subsets from Thpokfl/fl B2m−/− mice expressing or not the Thpok-RKF transgene.
(J) Numbers of CD44lo CD24lo TCRβhi thymocytes, CD4+ CD8− (top left) or CD8+ (including CD4+ and CD4−, top right) and of CD44lo TCRβ+ CD4+ CD8− splenocytes (bottom) in mice shown in (I).
Data (I-J) are representative three independent experiments totaling n= 6 (Cd4-Cre− littermates), 8 (Cd4-Cre+) or 10 (Cd4-Cre+ Thpok-RKF+) mice. One-way ANOVA followed with Tukey multiple comparison tests ****p<0.0001, ns: P>0.05. Error bars indicate standard deviation.
