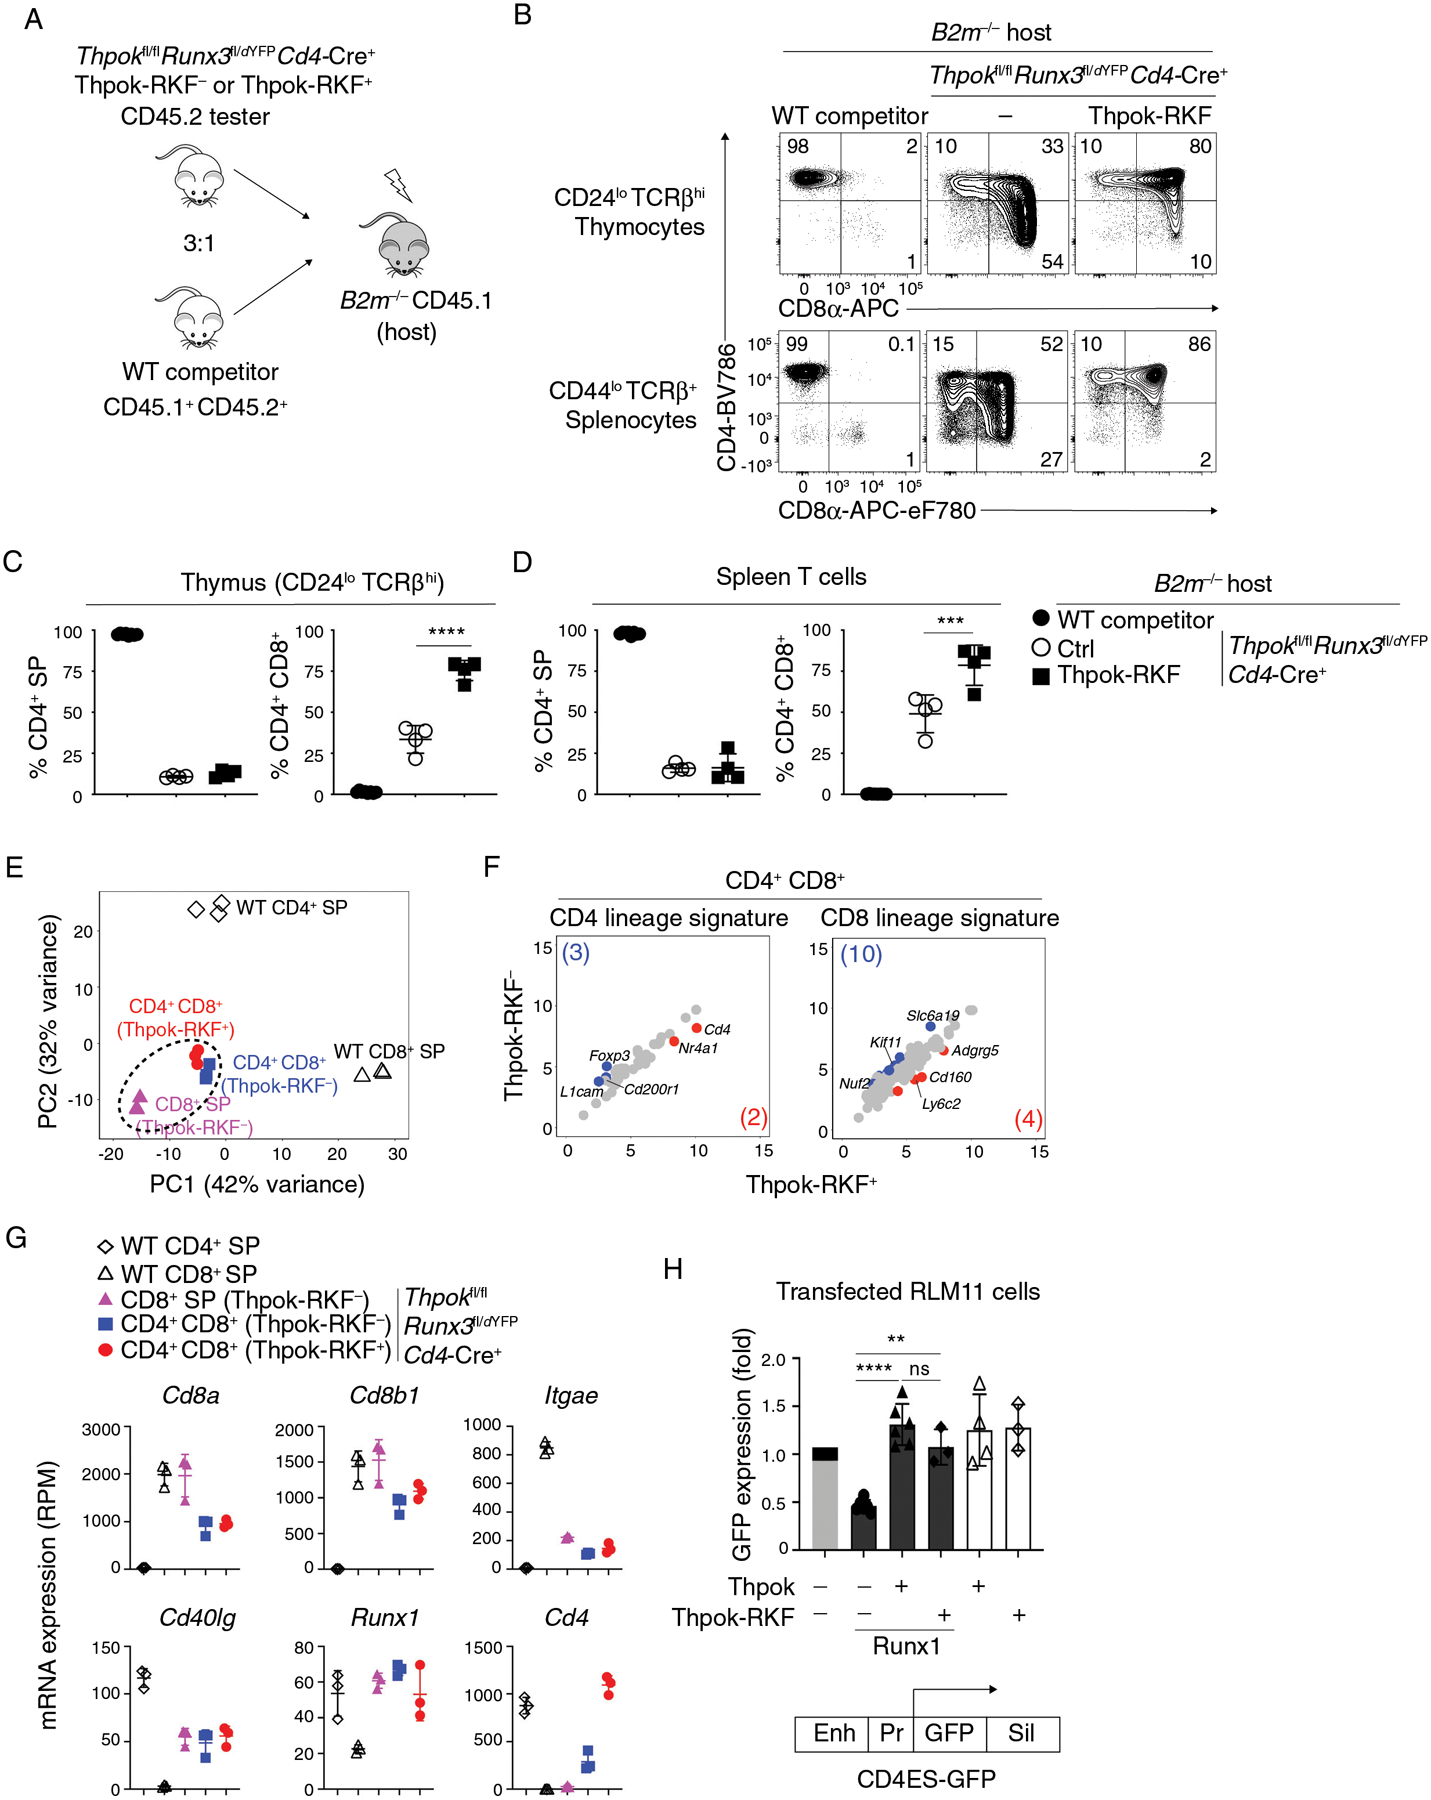
Figure 8. Runx3-independent function of Thpok-NuRD complexes.

(A) Generation of mixed bone marrow chimeras from CD45.2+ tester (of indicated genotype) and CD45.1+ CD45.2+ (wild-type competitor) cells, analyzed in panels B-G.
(B) Expression of CD4 and CD8 in CD44lo TCRβhi CD24lo thymocytes from B2m−/− mixed chimeras generated as in (A).
(C, D) Percentage of CD4+ SP (left panel) or CD4+ CD8+ (right panel) cells among tester-derived CD44lo TCRβhi CD24lo thymocytes (C) or CD44lo TCRβ+ splenocytes (D).
Data (B-D) are from one set of 4 chimera and are representative of a total of 2 independently generated sets of chimeras with 4–5 mice per group. One-way ANOVA followed with Tukey multiple comparison tests ***p<0.001, ****p<0.0001. Error bars indicate standard deviation.
(E-G) RNA-seq analyses of CD44lo CD24lo CD69lo TCRβhi thymocytes of indicated genotypes and purified as in Fig. S8, that were CD4+ SP, CD8+ SP, or CD4+ CD8+. Data is representative of three separate RNA samples for each population (two biological replicates one of which split into two RNA samples subsequently processed separately).
(E) Principal-component analysis (PCA) displays cell subsets according to the first two components. Each symbol represents an individual RNAseq sample.
(F) Scatter plots comparing CD4 lineage (41 genes) and CD8 lineage signatures (121 genes) (defined as WT CD4+ SP vs WT CD8+ SP, log2 (Fold Change) >2 or <−2, FDR < 0.05, Table S2) in Thpok-RKF− and Thpok-RKF+ CD4+ CD8+ thymocytes. X-axis and y-axis present log2 RPM. Genes with 2-fold or greater differential expression between subsets (and FDR < 0.05) are shown in blue and red (gene numbers are shown in parentheses), respectively.
(G) Graphs display expression (RPM) of indicated genes in each analyzed cell subset (symbols on top). Each symbol represents a distinct sample. Error bars indicate standard deviation.
(H) GFP expression (indicative of Cd4 promoter activity) in RLM-11 cells transfected with (i) a GFP-based reporter plasmid for Cd4 gene expression (schematic at bottom) (ii) a vector expressing Cd8α as an internal control and (iii) expression vectors encoding Runx1, Thpok or Thpok-RKF as indicated. Enh, Pr and Sil indicate the Cd4 proximal enhancer, promoter and silencer, respectively (76, 110). Data are expressed relative to transfection with neither Thpok nor Runx1 vector (leftmost bar) and summarize more than three independent experiments. Each symbol represents a separate transfection. One-way ANOVA followed with Tukey multiple comparison tests. Unpaired t test. **p<0.01, ****p<0.0001, ns, p>0.05. Error bars indicate standard deviation.
