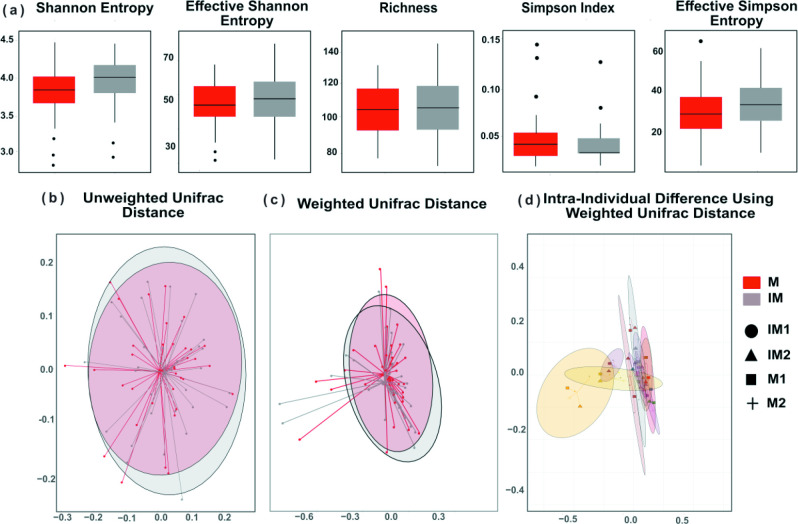
Fig. 3.
(a) Alpha diversity measures associated with intervention (IM) and non-intervention meals (M). There was no significant difference identified between the groups. (b,c) NMDS visualizations of beta diversity analysis using the unweighted (b) or weighted (c) unifrac distance. (d) NMDS visualizations of beta diversity for intra-individual patients across two intervention meals and their respective control using weighted unifrac distances.

