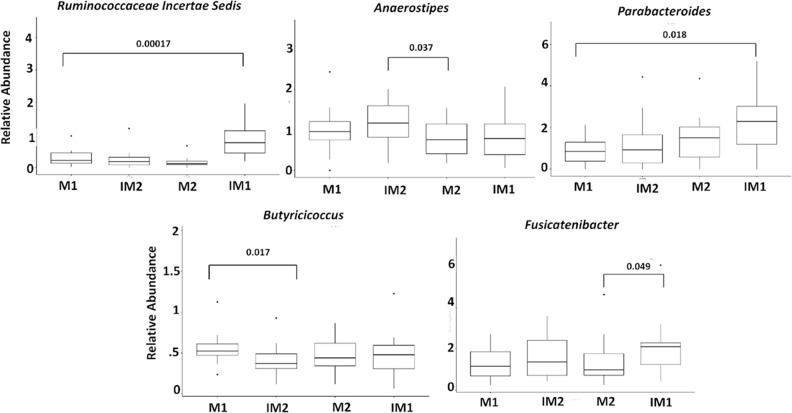
Fig. 5.
Boxplots representing significant differences between mean proportions of genera between four meal groups. Significance was tested using the non-parametric Wilcoxon rank test. IM1 and IM2 represent the first and second interventional meals, respectively. M1 and M2 represent the first and second non-intervention meals, respectively.

