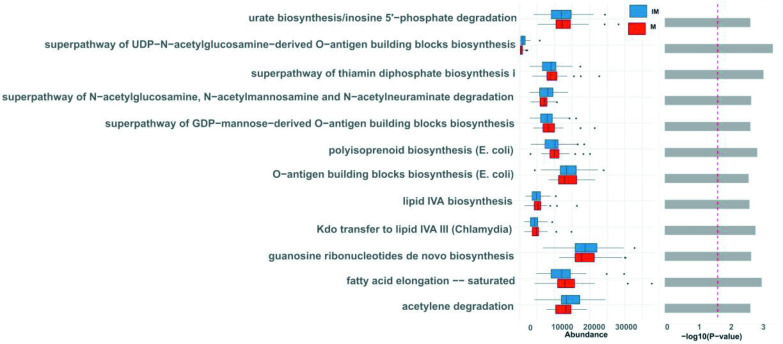
Fig. 8.
Bar plot showing pairwise group comparisons of significant pathways. Wilcoxon test was performed on relative abundance, and extended error bar plots were used for the comparison between IM and M groups. Only predicted functions and pathways with p < 0.05 are shown. Bar plots on the left side display the mean proportion of each KEGG Orthologues term with −log10 p-value while those on the right display the mean proportion of each KEGG pathway with −log10 p-values.

