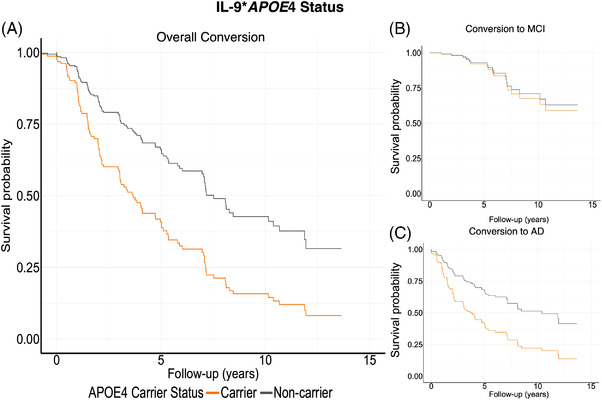
FIGURE 3.

Survival curves for CSF neuroinflammatory marker, IL‐9. Panel A displays overall conversion to either MCI or AD, split between APOE ε4 carriers and noncarriers. Orange represents APOE ε4 carriers, and grey, non‐carriers, illustrate that APOE ε4 carriers convert at higher rate. When split between conversion status, these results were driven by conversion to MCI (panel B). Conversion to AD was not significant (panel C)
