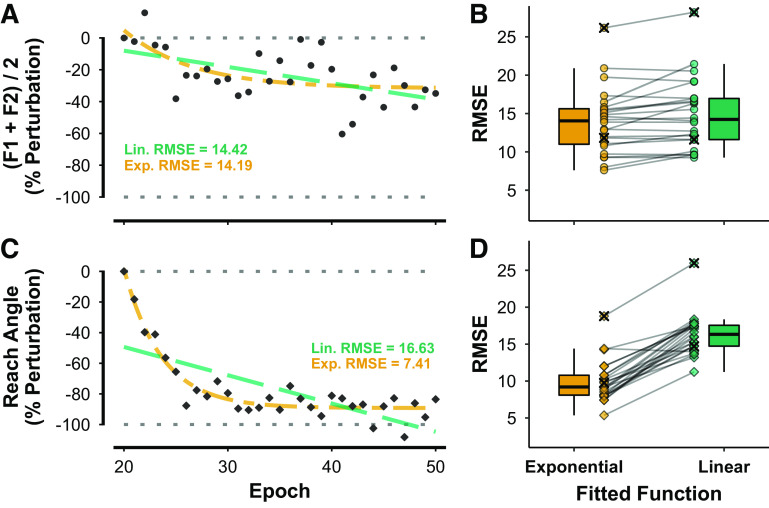
Figure 5.
Linear (Lin; green) and exponential (Exp; orange) model fitting for individual participant adaptation profiles in the sudden condition of the speech and reach tasks. Illustrations for a representative participant (A for speaking, C for reaching) show raw data and fitted functions together with root mean square error (RMSE) values for each fit (F1, F2: 1st and 2nd formant frequencies). Boxplots (B for speaking, D for reaching) show the RMSE values for exponential and linear fits for all participants. Two participants (1 in each task, both fitted functions) were found to have outlying data. These participants were not included in the final ANOVA and are marked with ×.

