
Fig. 1. Average brain nicotine accumulation curves (±SE) after inhalation of a single puff of vapor from an E-cig and single puff of smoke from a C-cig (n = 16).
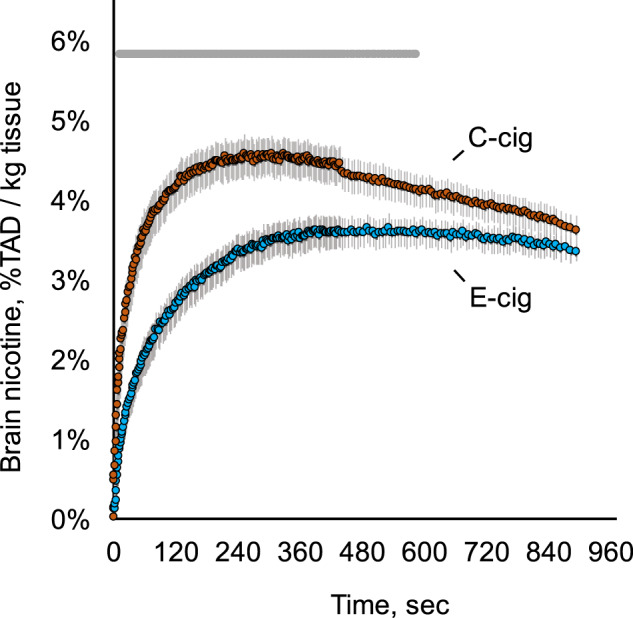
Gray straight line represents the time interval when the difference between the products was statistically significant (t-test, p < 0.05). Brain nicotine accumulation per kg of tissue mass was expressed as a percentage of the total absorbed dose (TAD) of 11C-nicotine.