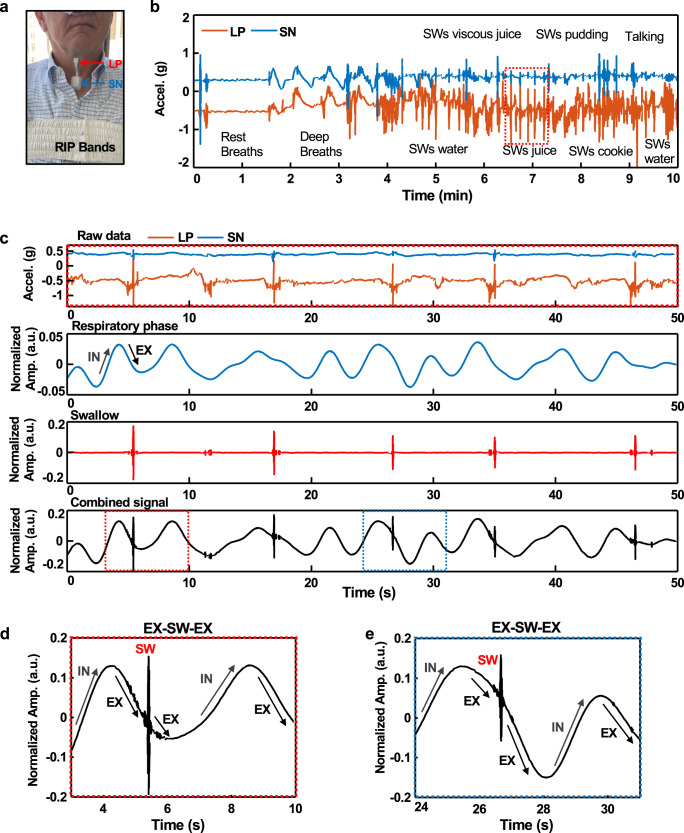
Fig. 4. Measurements from a patient with Parkinson’s disease.
a Image of the subject with an umbilical mechano-acoustic (UMA) device and RIP bands. b Raw data from the UMA device, corresponding to accelerations measured at the SN (blue) and LP (orange). The activities illustrated here include three different respirations followed by swallows associated with various liquids and food. c Graphs from top to bottom show data: unprocessed, corresponding to swallowing of juice as illustrated in the red dashed box of the frame a; bandpass filtered between 0.1 and 0.8 Hz; high pass filtered at 90 Hz; combined, filtered data to highlight swallowing and respiration. d, e Data corresponding to the regions highlighted by the red and blue dashed boxes in the bottom graph of frame c.

