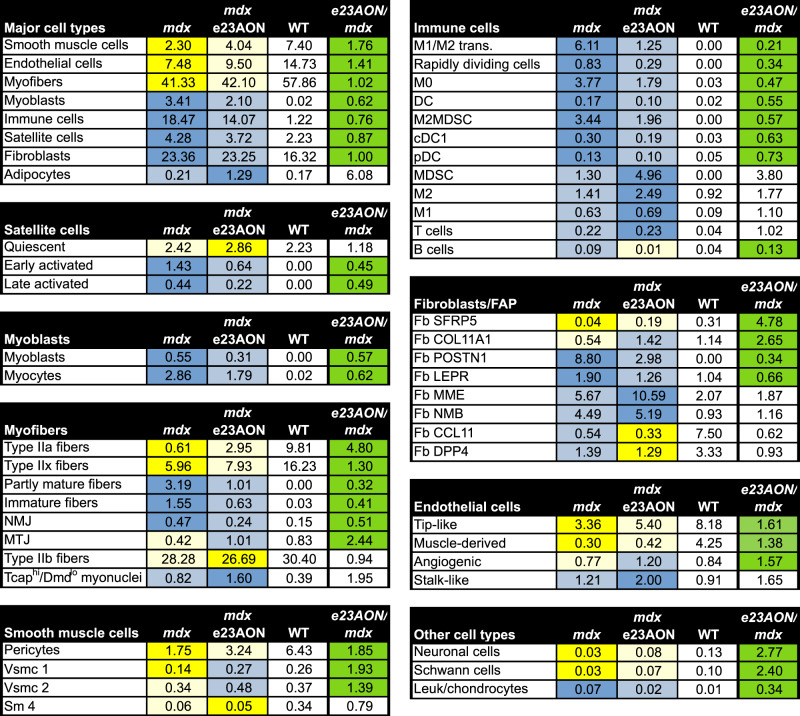
Fig. 2. Frequencies of intramuscular cell populations in WT and mdx mice and partial normalization of most populations in response to e23AON treatment of mdx.
Percentages of each cell population for each pooled treatment condition, mdx (n = 4), mdx e23AON (n = 4), WT (n = 3). Following the major cell types, cell types are further broken down to their respective subclusters. Blue = increase in percentage relative to WT, Yellow = decreased in percentages relative to WT. Rightmost column shows the effect of e23AON treatment relative to mdx, green denotes that cell numbers of mdx treated with e23AON recovered a more WT percentage.

