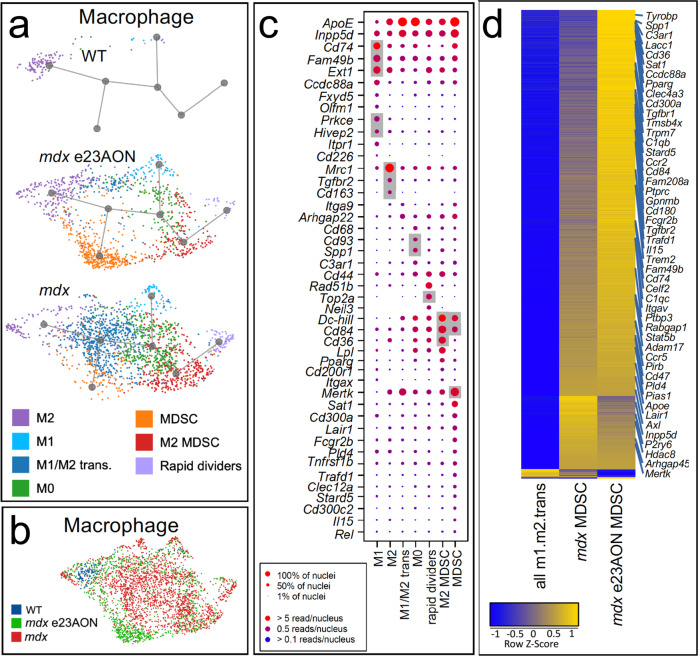
Fig. 4. Expansion of anti-inflammatory macrophage populations with dystrophin loss and rescue.
a U-map pseudotime analysis and lineage tracing of macrophages reveals subset types for WT (n = 3), mdx e23AON (n = 4), and mdx (n = 4). Macrophage subtypes are arranged according to their transcriptional relatedness and each subcluster color is matched to the legend for cell types shown in a and c. b Macrophage nuclei are organized as in a but color coded by mouse source as indicated. Gray background indicates known markers of the respective cell type on x-axis. c Gene expression for selected genes characterizing macrophage cell subset populations identified in a. (Complete list of significantly different genes is found in Supplementary Data 2). Dot size indicates percent of nuclei expressing the gene, dot color indicates level of expression. d Heatmap of gene expression changes across macrophage subsets and treatment conditions, including total M1/M2 transitional, MDSC from mdx, and MDSC from mdx e23AON, which are significantly expanded compared to untreated mdx. Yellow indicates higher gene expression. Heatmap shows the upregulation of MDSC characteristic genes as cells progress form M1/M2 transitional to mdx MDSC, and a further increase within MDSC with e23AON treatment (mdx e23AON).

