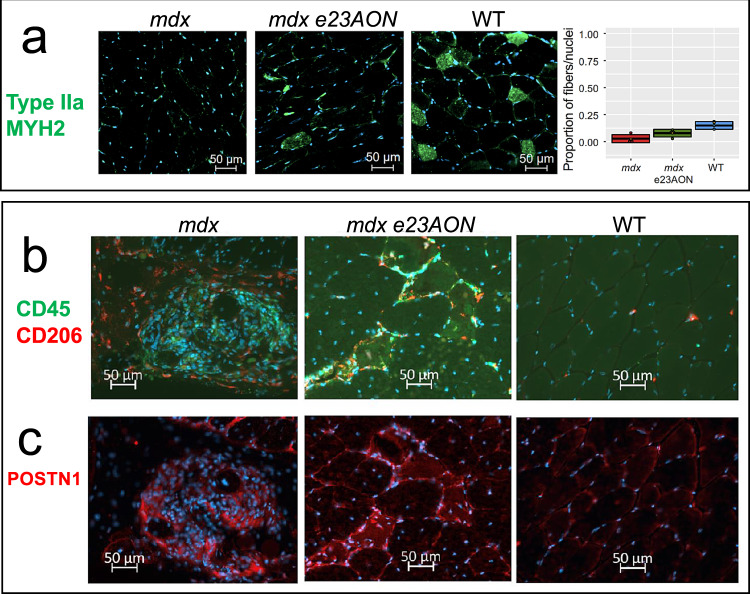
Fig. 6. Immunofluorescence staining of muscle cross sections of some identified differentially expressed gene products.
a MYH2 staining reveals preferential reduction in Type IIa Fibers in mdx and recovery in e23AON-treated mdx. Example immunofluorescence images of staining for each mouse are shown. MYH2 were stained (Green) in muscle sections from WT (n = 3), mdx e23AON (n = 4), and mdx (n = 4) mice, in combination with DAPI (blue) to mark nuclei. Quantification of the proportion of type IIa fibers was performed by counting the number of MYH2 + fibers out of >200 fibers per section from well preserved sections from each mouse (mdx n = 4, mdx e23AON n = 4, WT n = 3). Thick lines on box plot shows mean proportion across all samples in each treatment condition, box shows 1 standard deviation. Individual datapoints are shown as black dots on plot. Raw data values are listed in Supplementary Data 7. Red dot indicates the proportion myonuclei for each respective fiber type for each mouse type from snRNASeq. b e23AON treatment promotes M2 expansion. CD45 (green) and CD206 (red) were stained in muscle sections from WT (n = 3), mdx e23AON (n = 4), and mdx (n = 4) mice, in combination with DAPI (blue) to mark nuclei. Regions were chosen to best reflect number and type of immune cells present and differences in levels of immune infiltration occurring with disease and treatment. While untreated mdx mice show massive muscle infiltration of CD45 + non-M2 immune cells (green, b), e23AON-treated mdx mice show increased M2 cells as a percent of total CD45 + immune cells (red, b). c POSTN1 protein was probed in fibrotic lesions in sections from WT (n = 3), mdx e23AON (n = 4), and mdx (n = 4) mice. POSTN1 expression within fibrotic lesions was highest in mdx, and was reduced in mdx e23AON, and absent in WT animals.

