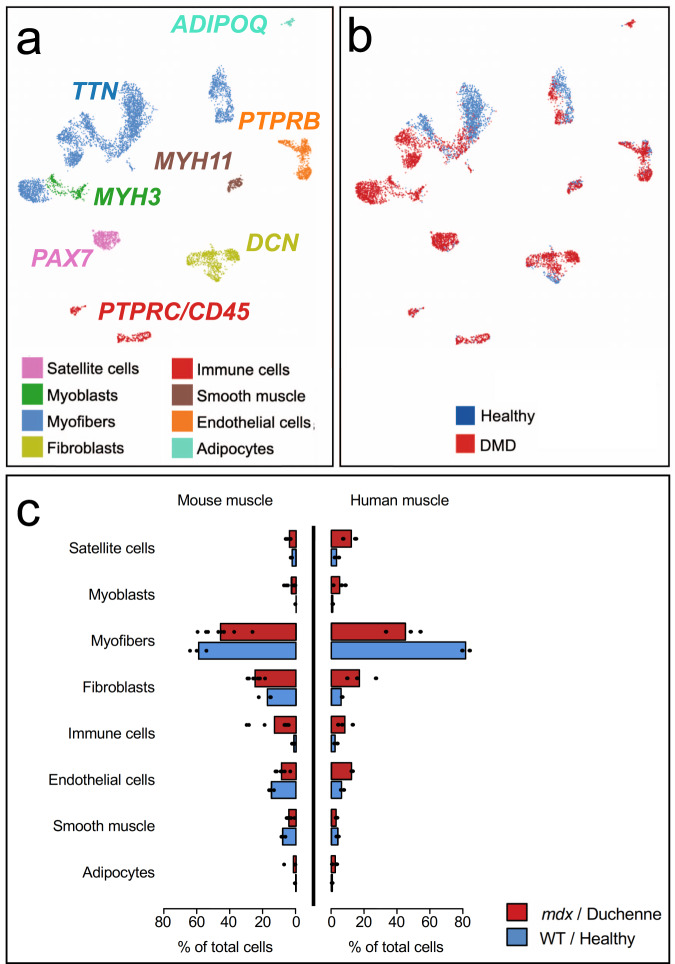
Fig. 7. Identification of cell populations in human vastus lateralis from healthy and DMD individuals using snRNAseq and comparison with mdx and WT mice.
a Umap clustering of human VL single nuclei transcriptomes. Major cell types were labeled using canonical gene markers common to mouse and human, and labeled as indicated for each major cell type (see Supplementary Fig. 22 for all human cell subtypes and frequencies for healthy and DMD). Genes significantly associated with each cluster and subcluster were identified and reported in Supplementary Figs. 23–27, and Supplementary Data 9. b Individual nuclei are labeled as from a DMD (red) or healthy (blue) and plotted as per the U-map clusters identified in a to show disease-related expression shifts. c DMD (n = 3) versus healthy (n = 2) and mdx (n = 8) versus WT (n = 3) comparison of snRNAseq identified major cell-type proportions are highly concordant. Bar plots indicate mean percentage of total nuclei belonging to each major cell type, individual datapoint are shown as black dots. Raw data values are listed in Supplementary Data 8.

