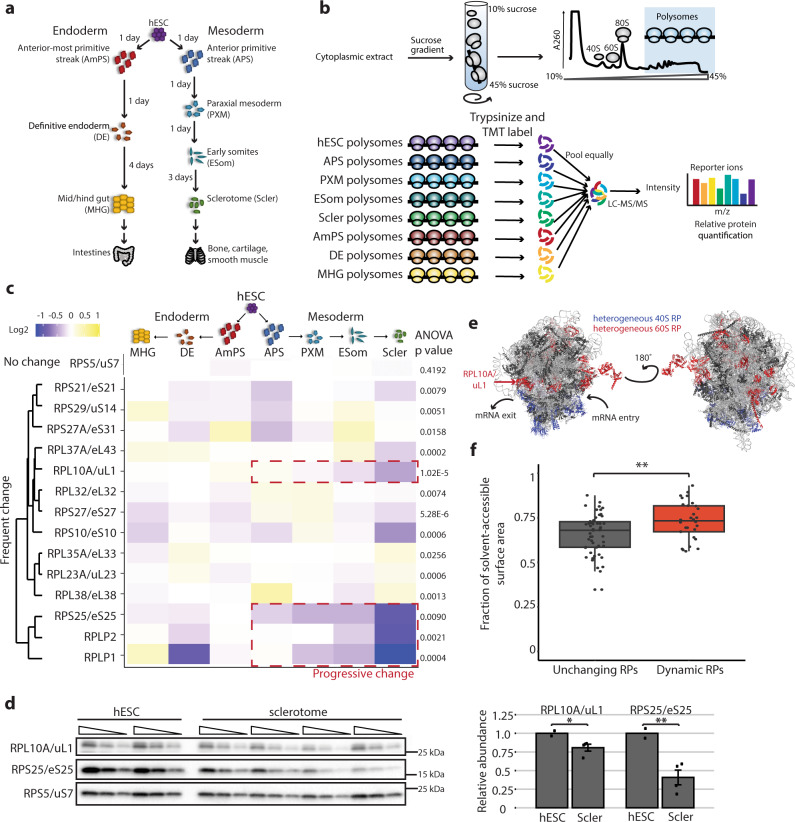
Fig. 1. Quantitative proteomics reveals ribosome composition changes during hESC differentiation.
a Schematic of hESC differentiation down the endoderm lineage to the mid/hindgut and down the mesoderm lineage to the sclerotome. b Schematic of polysome isolation by sucrose-gradient fractionation and labeling with tandem mass tags (TMT) to quantify each RP in a differentiated cell sample relative to the hESC starting population. c Heatmap of relative polysome abundance for RPs that change significantly by at least 10% in at least two differentiated cell types relative to hESCs. Several show progressive changes in abundance during mesoderm differentiation (red dashed boxes). One RP (RPS5/uS7) that does not change significantly is also included as an illustrative example. Heatmap values are median ratios of polysome abundance in each differentiated cell relative to hESCs in log2 scale, n = 6 for each cell type except for anterior primitive streak and mid/hindgut (n = 7 each), and P values for each RP were calculated by ANOVA. d Western blot of hESC (n = 2) and sclerotome (n = 4) polysome samples, each loaded as a serial dilution (1, 0.5, 0.25 µg). RPL10A/uL1 and RPS25/eS25 expression were normalized to the non-heterogeneous RPS5/uS7 and the middle dilution (0.5 µg) was used for quantification (shown as mean +/− SEM). Student’s t test P value = 0.03 for RPL10A/uL1, 0.008 for RPS25/eS25. e Location of the 31 heterogeneous RPs in the polysome mass spectrometry on the human 80 S ribosome (PDB: 4v6x). Small and large subunit heterogeneous RPs are blue and red, respectively. Non-heterogeneous RPs are dark gray and rRNA light gray. RPL10A/uL1 (red arrow) is located near the mRNA exit tunnel. f Fraction of the surface area that is solvent-exposed for each RP on the human ribosome. The 31 RPs that change significantly in polysomal abundance are significantly more solvent-accessible (Mann–Whitney test P = 0.0055), indicating they are enriched at the surface of the ribosome. Box is the interquartile range (IQR), center line is the median, whiskers represent 1.5*IQR from the box boundaries, and each point represents a single RP. *P value < 0.05; **P value < 0.01. Source data are provided as a Source Data file.

