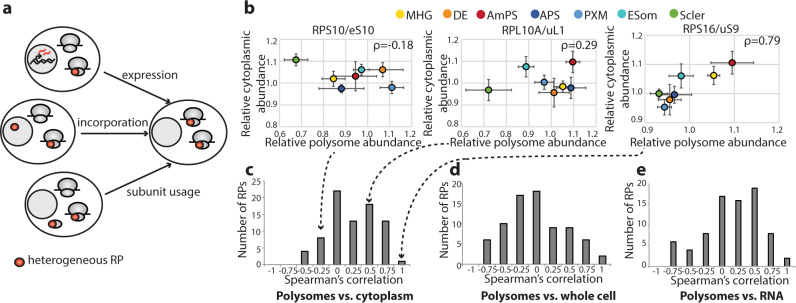
Fig. 2. Polysome composition is regulated at multiple levels.
a Schematic of possible mechanisms regulating changes in RP abundance in the polysomes across cell types. b Scatterplots of median polysomal and cytoplasmic protein relative abundance in each differentiated cell relative to hESCs for RPS10/eS10, RPL10A/uL1, and RPS16/uS9 with Spearman’s correlation coefficients (ρ) in upper right corners. Error bars are standard error and points are color-coded by cell type. N = 6 for all cell types and sample preparations except for the following: n = 7 for anterior primitive streak and mid/hindgut polysome samples and n = 8 for mid/hindgut cytoplasmic samples. Dashed arrows indicate the locations of these RPs in the histogram in (c). c Histogram of Spearman’s correlation coefficients for each RP comparing polysomal and cytoplasmic protein abundance (same n as in (b)). d Histogram of Spearman’s correlation coefficients for each RP comparing polysomal (same n as in (b)) and whole-cell protein abundance (n = 5 for early somite, paraxial mesoderm, and mid/hindgut whole-cell samples; n = 6 for anterior primitive streak, sclerotome, anterior-most primitive streak, and definitive endoderm whole-cell samples). e Histogram of Spearman’s correlation coefficients for each RP comparing polysomal (same n as in (b)) and mRNA abundance (n = 3 for mesoderm lineage, n = 1 for endoderm lineage). MHG mid/hindgut, DE definitive endoderm, AmPS anterior-most primitive streak, APS anterior primitive streak, PXM paraxial mesoderm, ESom early somite, Scler sclerotome.

