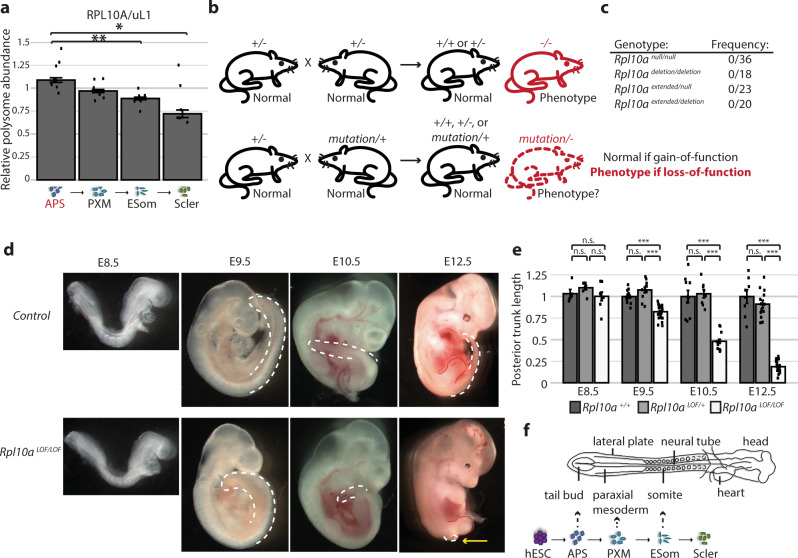
Fig. 3. A loss-of-function mouse model uncovers a specialized role for RPL10A/uL1 in the paraxial mesoderm lineage.
a Median relative abundance of RPL10A/uL1 in the polysomes of the mesoderm lineage relative to hESCs. N = 6 for all cell types, except n = 7 for primitive streak and error bars are standard error. Student’s t test P values: anterior primitive streak to early somites 0.006, anterior primitive streak to sclerotome 0.03. b Schematic of the genetic complementation test to identify loss-of-function mutations. c Observed frequencies of Rpl10a null/null homozygotes, Rpl10a deletion/deletion homozygotes, Rpl10a extended/null double heterozygotes, and Rpl10a extended/deletion double heterozygotes. d Lateral views of E8.5, E9.5, E10.5, and E12.5 Rpl10a LOF/LOF and control embryos. The tail bud is traced in white and indicates the posterior trunk truncation; the hindlimb is also traced in red on the E12.5 images. e Quantification of posterior trunk length at E8.5, E9.5, E10.5, and E12.5. Graph shows average length relative to wild-type with SEM error bars. No significant differences were observed between wild-type and Rpl10a LOF/+ embryos; Rpl10a LOF/LOF embryos were significantly different from both wild-type and Rpl10a LOF/+ embryos at all stages except E8.5. For E8.5 wild-type n = 5, Rpl10a LOF/+ n = 7, Rpl10a LOF/LOF n = 8; for E9.5 wild-type n = 13, Rpl10a LOF/+ n = 11, Rpl10a LOF/LOF n = 25; for E10.5 wild-type n = 10, Rpl10a LOF/+ n = 8, Rpl10a LOF/LOF n = 15; for E12.5 wild-type n = 8, Rpl10a LOF/+ n = 13, Rpl10a LOF/LOF n = 19. Wild-type vs. Rpl10a LOF/LOF Student’s t test P values: 0.65 (E8.5), 2.55 × 10⁻⁷ (E9.5), 2.45 × 10⁻⁵ (E10.5), 1.13 × 10⁻⁵ (E12.5); Rpl10a LOF/+ vs. Rpl10a LOF/LOF P values: 0.10 (E8.5), 5.31 × 10⁻⁶ (E9.5), 8.89 × 10⁻⁷ (E10.5), 1.20 × 10⁻¹⁰ (E12.5). f Schematic of gastrulation at the tail bud to produce the paraxial mesoderm lineage, with the embryonic tissues represented in the in vitro hESC differentiation indicated. APS anterior primitive streak, PXM paraxial mesoderm, ESom early somite, Scler sclerotome, *P value < 0.05; **P value < 0.01, ***P value < 0.001. Source data are provided as a Source Data file.

