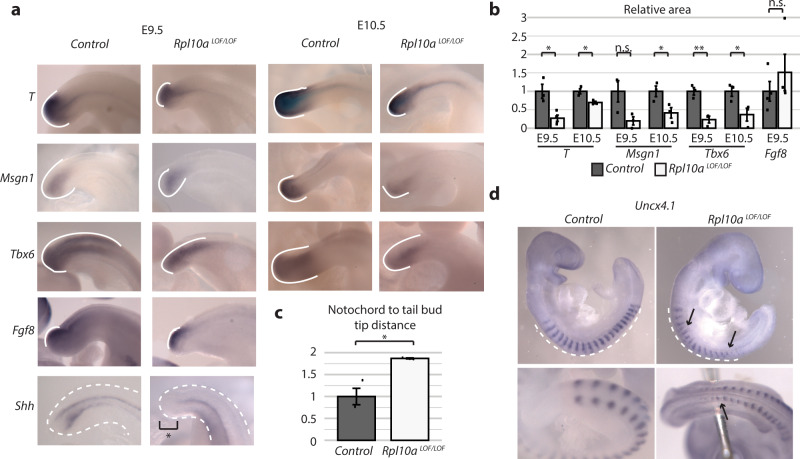
Fig. 5. Rpl10aLOF/LOF embryos exhibit defects in paraxial mesoderm lineage formation.
a Whole-mount in situ hybridizations in control and Rpl10a LOF/LOF embryos at E9.5 and E10.5. The region of expression at the tail bud is demarcated with a solid white line. A dashed white line outlines the tail bud in the Shh in situ. b Quantification of the area of staining relative to total tail bud area. For each probe, stage, and genotype n = 3 with the exception of Fgf8 (n = 4 for each genotype) and T (n = 4 for E9.5 Rpl10a LOF/LOF). Data are shown as mean +/− SEM, Student’s t test P values: 0.04 (T E9.5), 0.03 (T E10.5), 0.09 (Msgn1 E9.5), 0.045 (Msgn1 E10.5), 0.005 (Tbx6 E9.5), 0.049 (Tbx6 E10.5), 0.40 (Fgf8 E9.5). c Quantification of the distance between the end of the notochord, as demarcated by Shh in situ, and the tip of the tail bud (n = 3). Distances were normalized to the distance between limb buds and otic placode in each embryo to account for any differences in embryo size. Data are shown as mean +/− SEM, and significance was calculated using Student’s t tests (P value = 0.04). d Whole-mount in situ hybridizations for Uncx4.1 in control and Rpl10a LOF/LOF embryos at E9.5, lateral view (top), and view of the posterior end of the embryo (bottom). The dashed white line demarcates the region of expression; black arrows indicate abnormalities in somite boundaries and spacing. *P value < 0.05; **P value < 0.01. Source data are provided as a Source Data file.

