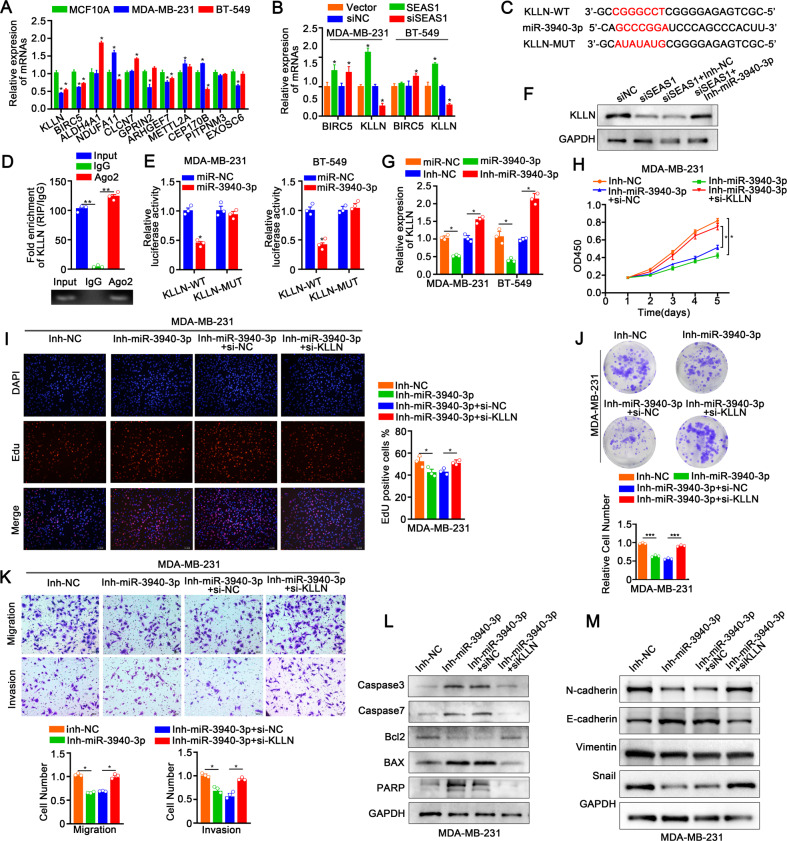
Fig. 6. KLLN is the direct target gene of miR‑3940‑3p.
A RT-qPCR analysis shows the expression levels of several miR-3940-3p target genes including KLLN in the TNBC cell lines and the normal breast epithelial cell line. B RT-qPCR analysis shows the expression levels of the miR-3940-3p target genes, BIRC5 and KLLN in the control, SEAS1-silenced, and SEAS1-overexpressing TNBC cell lines. C The wild-type and mutated binding sites of miR-3940-3p in the 3′-UTR of KLLN. D RT-qPCR analysis shows the results of anti-AGO2 RIP assay. The relative levels of KLLN mRNA pulled down from the MDA-MB-231cell extracts using anti-Ago2 antibody and IgG are shown with the input. E Luciferase reporter assays show the luciferase activity in MDA-MB-231 cells co-transfected with luciferase reporter vector cloned with the wild-type or mutant 3′UTR sequence of KLLN. F Western blot analysis shows the levels of KLLN protein in SEAS1-silenced TNBC cells co-transfected with miR-3940-3p inhibitor and the corresponding controls. G RT-qPCR analysis shows the levels of KLLN mRNA in SEAS1-silenced TNBC cells transfected with the miR-3940-3p inhibitor and the corresponding controls. H–J CCK8, colony formation, and EdU assay results show the proliferation rates of the TNBC cells co-transfected with miR-3940-3p inhibitor and siRNA against KLLN (si-KLLN) and the corresponding controls. K Transwell assay results show the migration rates of TNBC cells co-transfected with the miR-3940-3p inhibitor and si-KLLN and the corresponding controls. L Western blot results show the levels of caspase 3, caspase 7, BAX, PARP, and Bcl2 proteins in the TNBC cells co-transfected with the miR-3940-3p inhibitor and si-KLLN and the corresponding controls. M Western blot results show the levels of EMT-related proteins, namely, N-cadherin, Vimentin, Snail, and E-cadherin in TNBC cells co-transfected with the miR-3940-3p inhibitor and si-KLLN and the corresponding controls. *P < 0.05, **P < 0.01, and ***P < 0.001. Representative data from at least 3 experiments with comparable results is shown in the figure.

