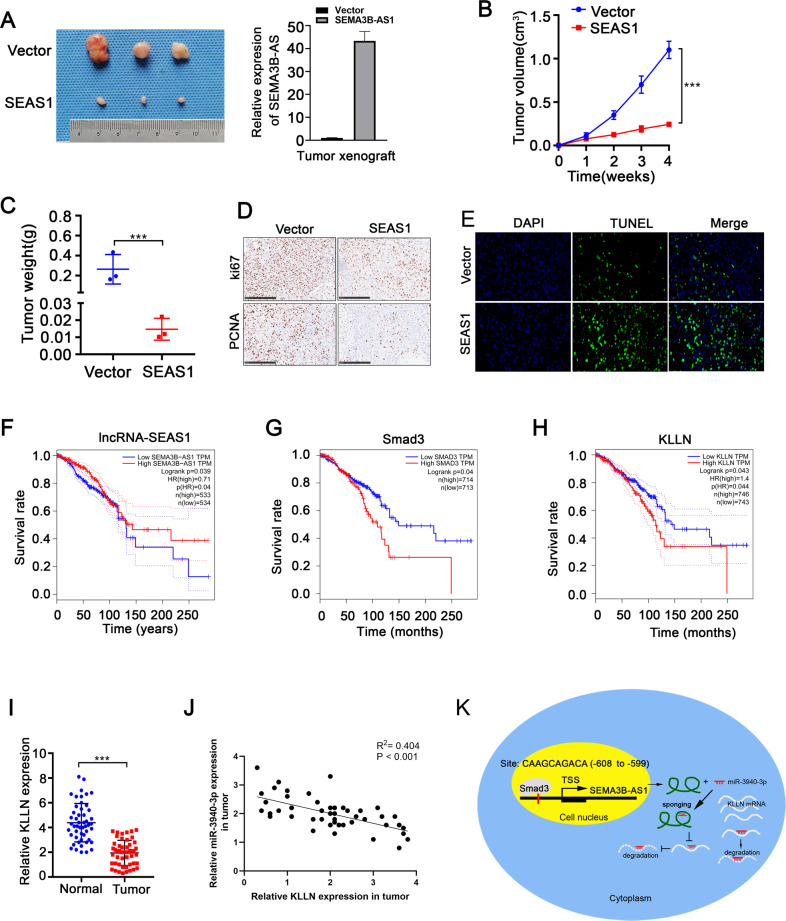
Fig. 8. SEAS1 overexpression inhibits tumor progression and highly correlated with favorable prognosis of TNBC.
A Representative images of xenograft tumors derived from SEAS1-overexpressing and vector control MDA-MB-231cells that were subcutaneously injected into Balb/c athymic nude mice. Relative expression levels of SEAS1 in the SEAS1-overexpressing and vector control MDA-MB-231cells are also shown. B, C Tumor weights and tumor volumes of xenograft tumors derived from the SEAS1-overexpressing and vector control MDA-MB-231cells are shown. Tumor volumes were calculated as volume = length × (width)2/2. The data are represented as mean ± SD. D Representative images show the differences between Ki67 and PCNA staining in the xenograft tumor tissues derived from SEAS1-overexpressing and vector control MDA-MB-231cells. E TUNEL assay results show the percentage apoptotic cells in the xenograft tumor tissues derived from SEAS1-overexpressing and vector control MDA-MB-231cells. F–H Kaplan–Meier Plotter database analysis shows the survival rate of breast cancer patients in the GEPIA dataset with high and low expression levels of F SEAS1, G SMAD3, and H KLLN. I RT-qPCR analysis shows the expression levels of KLLN mRNA in TNBC tissues and the adjacent normal breast tissues. J Spearman correlation analysis shows significant negative correlation between miR-3940-3p and KLLN expression levels in the breast cancer tissues (R2 = 0.527, P = 0.017). K Diagrammatic representation of the regulation of TNBC progression by the SMAD3/SEAS1/miR-3940-3p/KLLN axis. SMAD3 regulates transcription of SEAS1, which functions as a sponge for miR-3940-3p, the negative regulator of KLLN. *P < 0.05, **P < 0.01, and ***P < 0.001. Representative data from at least 3 experiments with comparable results are shown.

