Fig. 7.
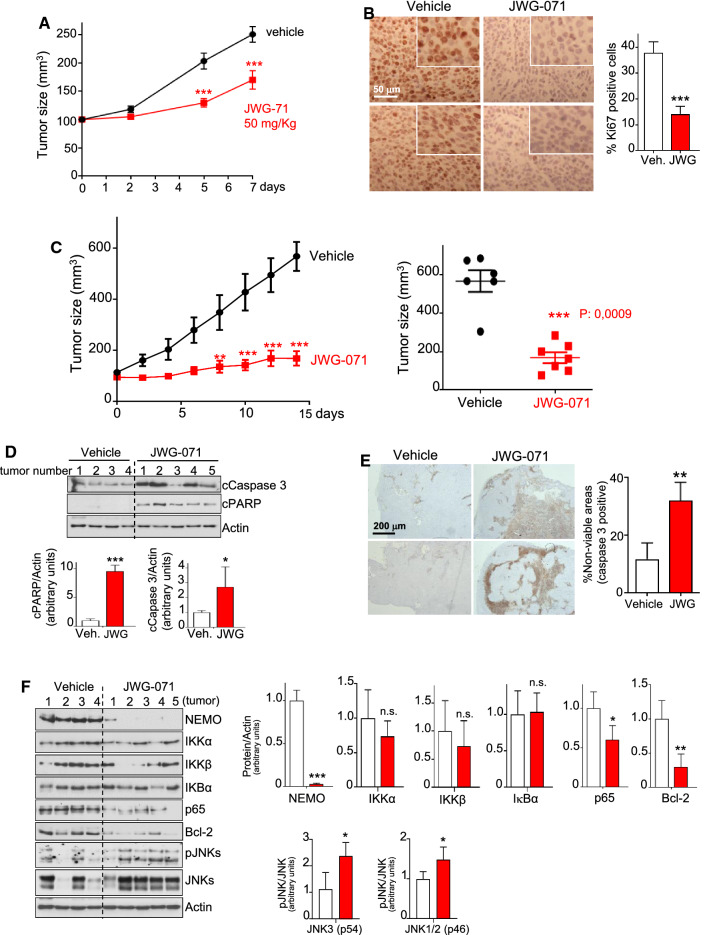
ERK5 inhibition impairs growth of EC tumor xenografts in vivo. A Tumor growth curve of subcutaneous xenograft (Ishikawa cells), treated i.p. with either vehicle or 50 mg/Kg JWG-071 daily. N = 6 mice per group. Data are presented as mean ± SEM. ****, P < 0.0001, two-way ANOVA Bonferroni. B Immunohistochemical analysis of Ki67 expression of xenograft tumors. Right histograms show Ki67 quantification. ***, P < 0.001. C, Tumor growth curves. Nude mice bearing Ishikawa cell subcutaneous xenograft tumors were daily treated i.p. with either vehicle (n = 6) or 50 mg/Kg JWG-071 (n = 6). Values represent the mean ± SEM. *, P < 0.05; ***, P < 0.001, two-way ANOVA Bonferroni. Right panel shows the corresponding scatter plot for tumors at day 14 of treatment. D–E Immunoblot (D) and cleaved caspase-3 immunohistochemical (E) analysis of the endometrioid xenograft tumors. Histograms show the corresponding quantification. F Immunoblot analysis of NF-κB pathway proteins from xenograft tumors. Histograms show the corresponding quantifications. B, D–F *, P < 0.05; **, P < 0.01; ***, P < 0.001

