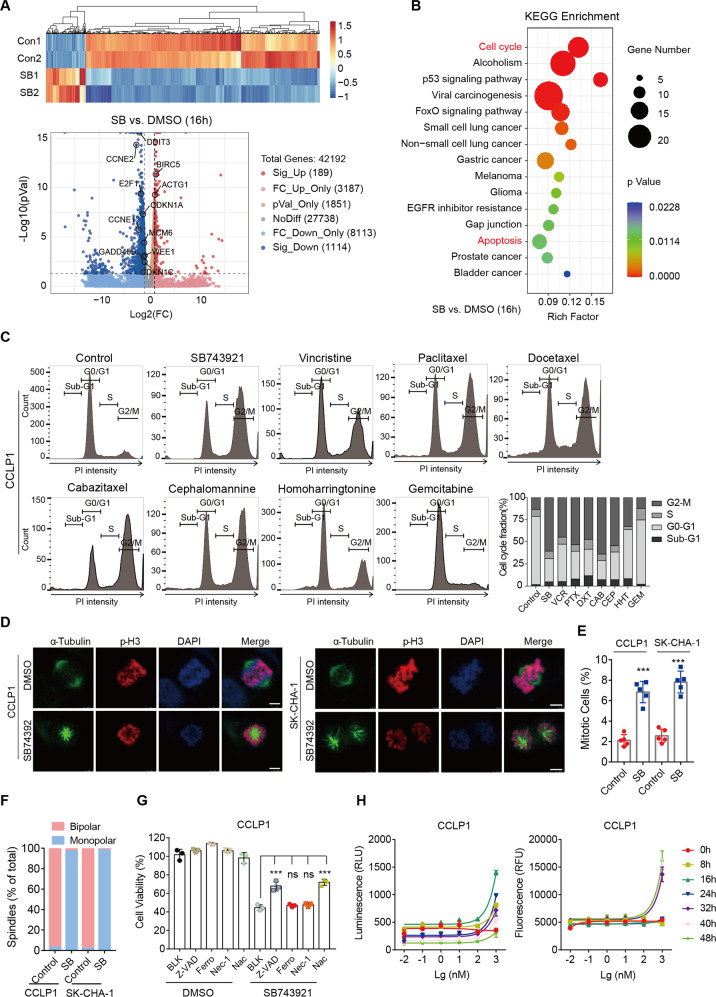
Fig. 4. KSP inhibition causes mitotic arrest and cell apoptosis.
A Heatmap and volcano plot of RNA-seq data from CCLP1 cells treated with SB743921 (10 nM, 16 h). Gene-expression alteration in the treated group was normalized by corresponding DMSO control. Significant genes were determined by Student’s t test and a threshold cutoff of q < 0.05, 2-fold change. Red, induced; green, repressed. B KEGG pathway analysis of genes affected by SB743921 treatment (10 nM, 16 h). C Cell cycle assessment by flow cytometry analysis. CCLP1 cells were treated with SB743921 (SB), paclitaxel (PTX), docetaxel (DXT), cabazitaxel (CAB), vincristine (VCR), cephalomannine (CEP), homoharringtonine (HHT) or gemcitabine (GEM) at a dose of 0.5 μM for 24 h. The histograms showed the fraction of cells in cell cycle phases. D Immunofluorescence of CCLP1 cells treated with SB743921 (0.5 μM, 24 h) and stained with α-Tubulin (green), p-H3 (red), and DAPI (blue). Scale bars, 10 μm. E Quantification of mitotic CCA cells after SB743921 treatment. P values were determined by two-tailed t test. F The fraction of bipolar and monopolar spindles in CCLP1 and SK-CHA-1 cells treated with SB743921 or DMSO. P values were determined by two-tailed t test. G Cell viability of CCLP1 cells treated with SB743921 alone or in combination with Z-VAD-FMK (Z-VAD, 50 μM), Ferrostatin-1 (Ferro, 20 μM), Necrostatin-1 (Nec-1, 20 μM) or N-Acetyl cysteine (Nac, 1 mM). P values were determined by one-way ANOVA. H Analysis of the type of cell death. CCLP1 cells were exposed to serial dilutions of SB743921 in the presence of the RealTime-Glo Annexin V Apoptosis and Necrosis Assay Reagent. Luminescence signal (RLU) represents apoptosis, and fluorescence signal (RFU) represents necrosis.

