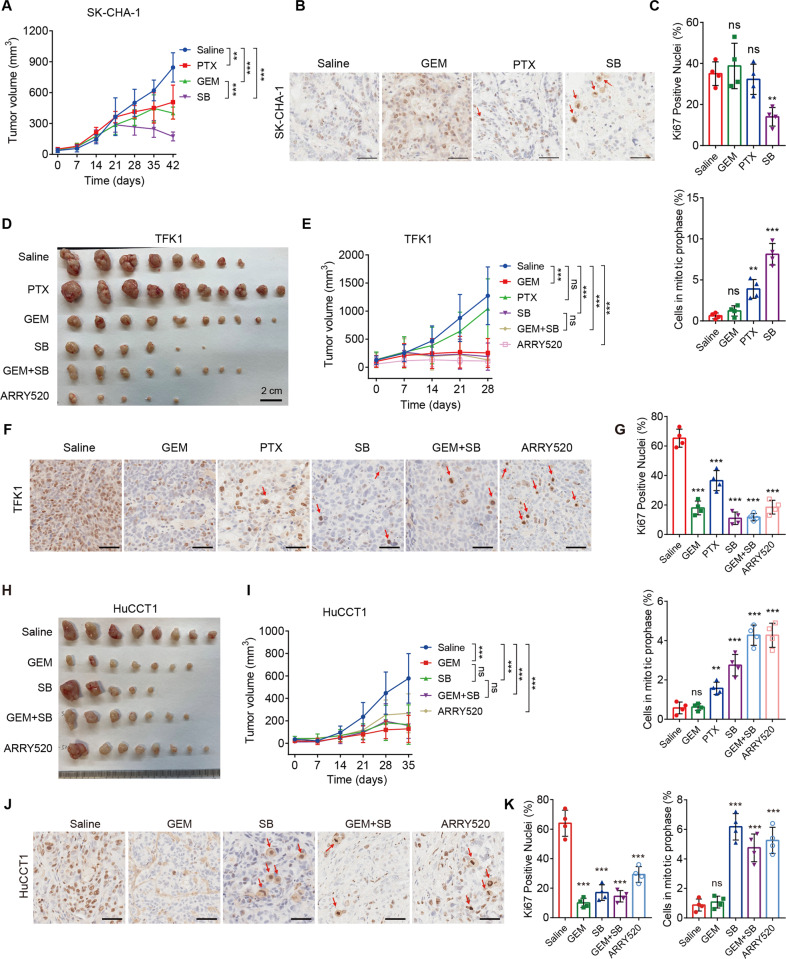
Fig. 5. KSP inhibition caused tumor suppression in CCA CDX models.
A Tumor volumes of SK-CHA-1 CDX models. Mice were allocated to four groups treated with SB743921 (5 mg/kg, n = 6), paclitaxel (10 mg/kg, n = 6), gemcitabine (10 mg/kg, n = 6), or saline (n = 6) twice a week for 6 weeks. B, C Representative images and quantification of Ki67 staining in SK-CHA-1 CDX tumors. Arrows indicate mitotic cells and the quantification of mitotic cells was shown. D Gross images of TFK1 CDX tumors. Mice were randomly allocated to different groups and treated with paclitaxel (10 mg/kg, n = 10), gemcitabine (10 mg/kg, n = 10), SB743921 (5 mg/kg, n = 6), ARRY520 (5 mg/kg, n = 5), gemcitabine plus SB743921 (n = 8), or saline (n = 8). E Tumor volumes of TFK1 CDX models. F, G Representative images and quantification of Ki67 staining in TFK1 CDX tumors. Arrows indicate mitotic cells and the quantification of mitotic cells was shown. H Gross images of HuCCT1 CDX tumors. Mice were randomly allocated to different groups and treated with gemcitabine (10 mg/kg, n = 7), SB743921 (5 mg/kg, n = 5), ARRY520 (5 mg/kg, n = 8), gemcitabine plus SB743921 (n = 7), or saline (n = 8). I Tumor volumes of HuCCT1 CDX models. J, K Representative images and quantification of Ki67 staining in HuCCT1 CDX tumors. Arrows indicate mitotic cells and the quantification of mitotic cells was shown. Scale bars, 50 μm. Panels A, E, and I were analyzed by two-way ANOVA; Panels C, G, and K were analyzed by the two-tailed unpaired t-test. **p < 0.01, ***p < 0.001, ns, not significant.

