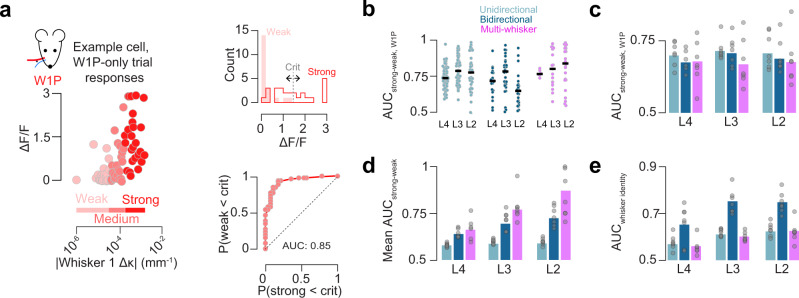
Fig. 5. Decoding of touch features by neuron type and layer.
a Example ROC analysis for single neuron touch force decoding (Methods). Left, per-trial peak ΔF/F as a function of Δκ. Shades of red indicate force bins each containing a third of trials. Top right, histogram of strong and weak ΔF/F responses, with example criterion point for generating ROC curve. Bottom right, example neuron ROC curve. b Decoding for all neurons from an example mouse of a given type and layer comparing neural response to strong and weak W1P touches. Dark line, median across neurons. c AUC across all mice for W1P touch force. Bar indicates cross-animal mean (n = 7 mice). d As in c, but pooled across all four single whisker trial types. e Discriminability of touching whisker identity. (mean, n = 7 mice). ROC, receiver operating characteristic; AUC, area under the curve.

