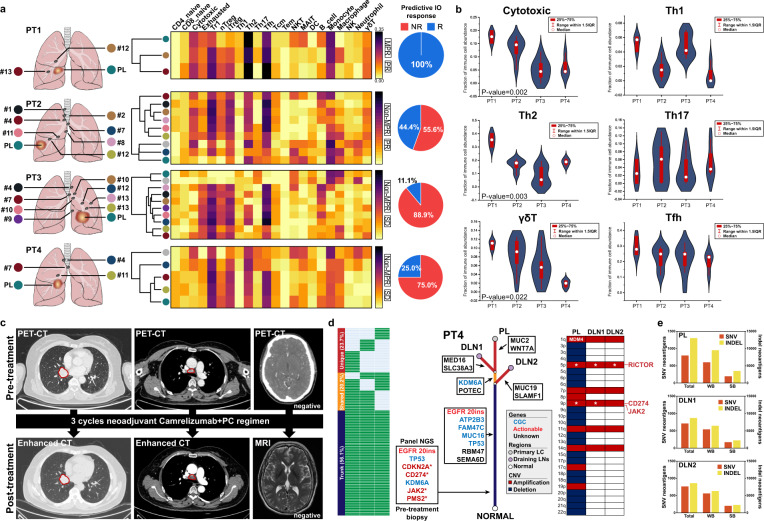
Fig. 3. Overview of infiltrating immune contexture and genomic profile of resected PL and DLNs after neoadjuvant immunotherapy.
a Non-supervised clustering of infiltrating immune microenviornment among PL and DLNs through ImmuCellAI. Pie chart indicates the proportion of samples which are antipated as responsive to immunotherapy. R Responder, NR Non-responder. b Comparison of specific immune cell subtypes among different patients. Kruskal-Wallis test was used to testify the difference among patients. Centre dots represent the median value of specific immune cell infiltration. Error bars represent the upper and lower quartiles and whiskers defines the range within 1.5IQR. c Radiological evaluation before and after neoadjuvant immunotherapy for PT4. d Genomic evolutionary trajectory between PL and DLNs of PT4. e Indel- and SNV-induced neoantigens burden among PL and DLNs through NeoPredPipe.

