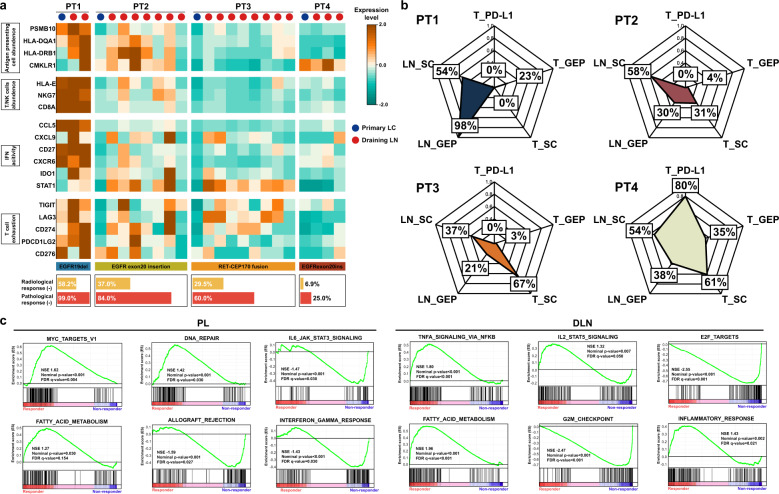
Fig. 4. Immune phenotypes and enriched functional pathway among PLs and DLNs.
a Expression profile of functional genesets including antigen presenting cell abundece, T/NK cell abundence, IFN activity and T cell exhasution were presented through z-score. b Radar plots of comprehensive immune phenotypes including PD-L1 expression in PL, T-cell inflamed GEP and suppressor cell score in PL and DLNs were scaled into 0–100%. T_PD-L1 represents expression of PD-L1 in tumor; T_GEP represents gene-expression profile of infiltrating lymphocytes in tumor; T_SC represents suppressor cell in tumor; LN_GEP represents gene-expression profile of infiltrating lymphocytes in draining lymph nodes; LN_SC represents suppressor cell in draining lymph nodes. c Gene set enrichment analysis (GSEA) of PL and DLNs upon responders and non-responders.

