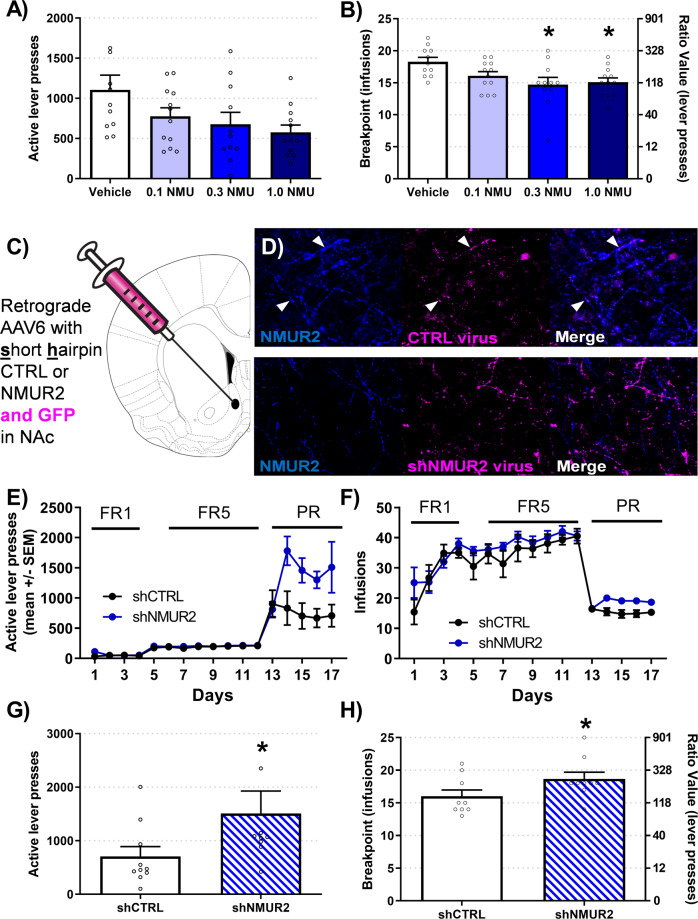
Fig. 1. NMU and NMUR2 controls breakpoints for cocaine.
A NMU decreased test day lever-presses for cocaine (0.75 mg/kg/inf) on a PR schedule (n = 10–12 per group; one individual Vehicle rat at 2536 lever presses not shown). B NMU decreased test day data breakpoints for cocaine. The breakpoint value is identified on the left axis and the corresponding ratio value of lever presses needed to receive one infusion is located on the right axis. Statistical comparisons were conducted on total infusions. C The schematic diagram for administration of retrograde knockdown of NMUR2 in the NAcSh is clarified. D Representative immunohistochemistry images of control hairpin (top) and NMUR2 hairpin (bottom) are illustrated with NMUR2 (blue) and virus GFP (magenta). E–F Daily acquisition of self-administration is illustrated by active lever presses and infusions. G–H Knockdown of NMUR2 increased test day active lever presses and breakpoints for cocaine (n = 10 per group; one individual shNMUR2 rat at 4585 lever presses not shown). Statistical comparisons were conducted on total infusions. Bar graph shows mean ± SEM. *p < 0.05.

