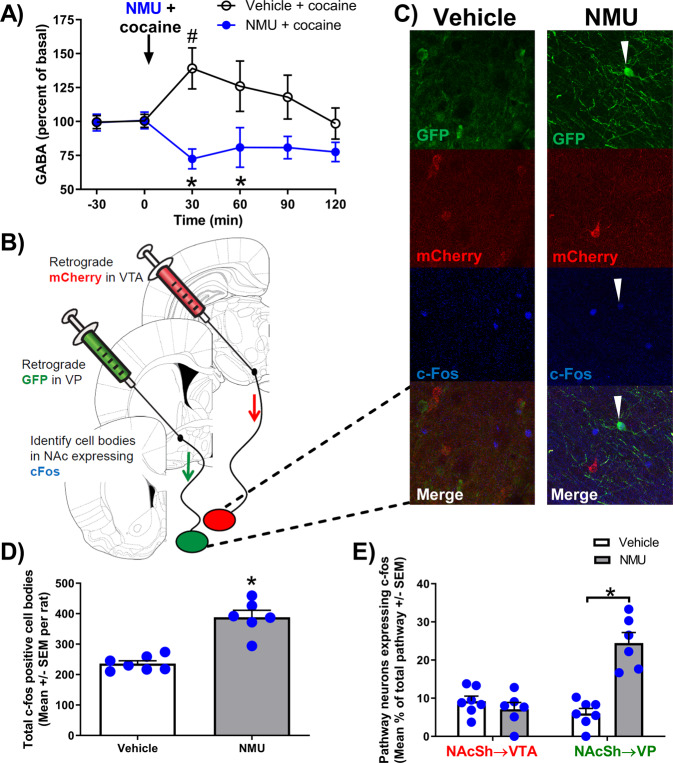
Fig. 2. NMU prevented cocaine-induced increase in GABA and preferentially increased phosphorylated c-Fos on NAcSh→VP projection neurons.
A Cocaine and NMU alter GABA concentrations in the NAcSh measured by microdialysis and mass spectrometry. The arrow indicates time of cocaine (10 mg/kg, IP), NMU (0.3 mg/kg, IP) or vehicle administration. #p < 0.05 compared to basal and *p < 0.05 between groups. B This illustration depicts microinjection sites of retrograde viral vector tracers into target brain regions (VTA or VP) and presents confocal images at 20X objective in the NAcSh. C Representative NAcSh confocal images of vehicle (left) and NMU-treated (right) illustrate NAcSh → VP cell bodies labeled with GFP (green), NAcSh → VTA cell bodies with mCherry (red), and phosphorylated c-Fos (blue). D NMU increased the average quantity of phosphorylated c-Fos positive cell bodies per rat in the NAcSh (n = 6–7 per group). E NMU preferentially increased phosphorylated c-Fos colocalization in the NAcSh → VP (GFP) pathway but not in the NAcSh → VTA (mCherry) pathway quantified from images of tissue from control or NMU-treated rats (n = 3–4 per group). Bar graph shows mean ± SEM. *p < 0.05.

