Fig. 1.
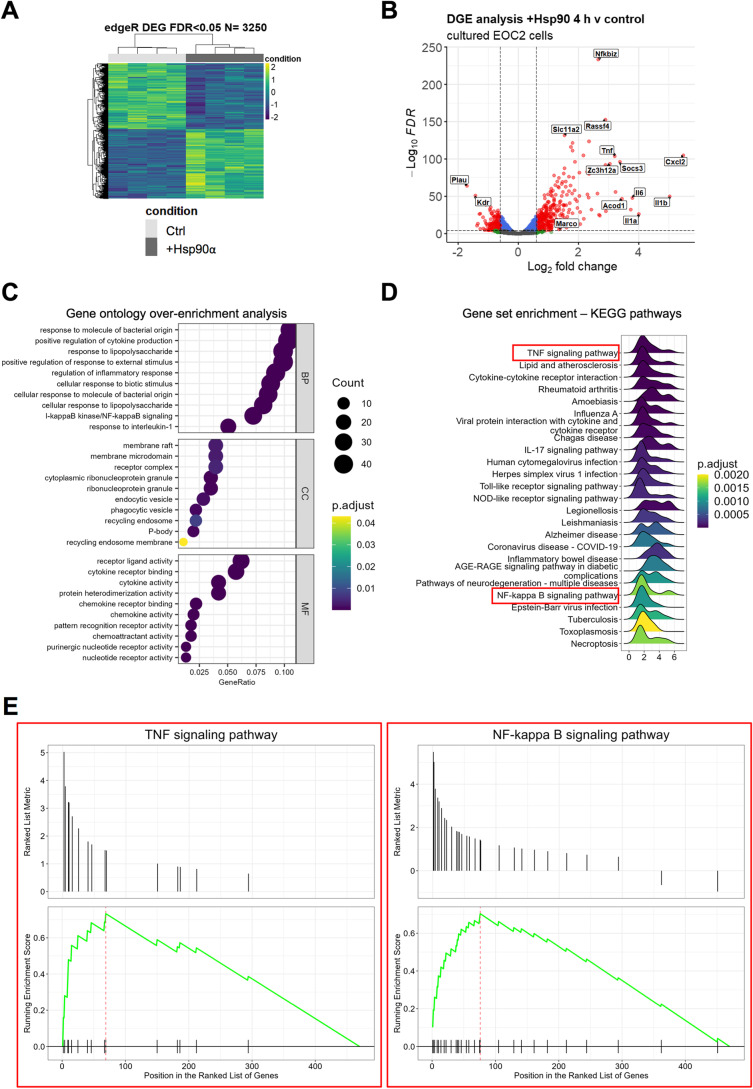
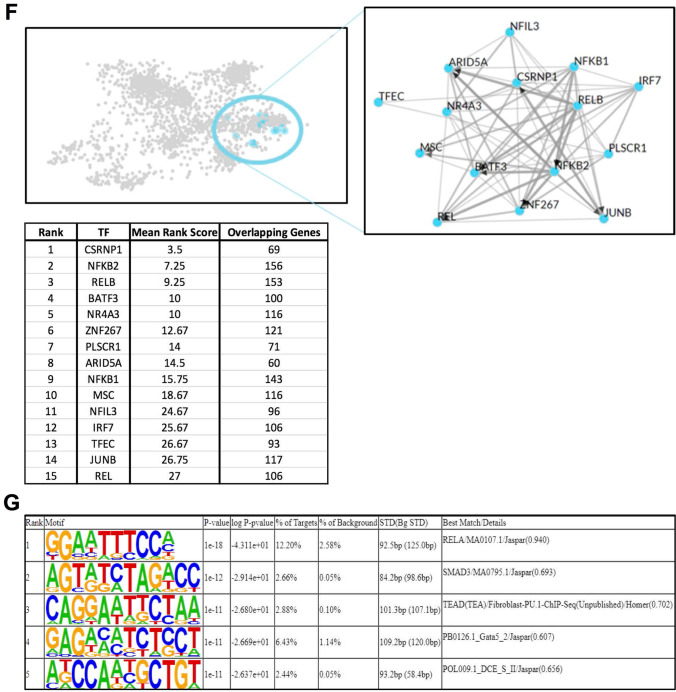
The transcriptional response to eHsp90α at 4 h is characterized by activation of NF-kB-regulated processes. A Heatmap representation of the 3250 DEG (FDR < 0.05) identified by RNA-seq analysis between EOC2 cells treated with 10 µg/ml Hsp90α for 4 h versus untreated control samples. B Volcanoplot representing the FDR and logFC values of changes in gene expression between EOC2 cells treated with 10 µg/ml Hsp90α for 4 h versus untreated control samples. Values for features that returned at least 3 counts per million (cpm) across 4 of the 8 samples with MGI symbols are shown. C Gene ontology over enrichment analysis was applied to the filtered EOC2 DEG list (FDR < 0.05, ± logFC 0.6) using the enrichGO function of the clusterProfiler package to return enriched descriptive terms belonging to the GO categories; biological process (BP), cellular component (CC), and molecular function (MF). D Ridgeplot of gene set enrichment of KEGG pathways performed on the same filtered EOC2 DEG list (FDR < 0.05, ± logFC 0.6) using the clusterProfiler function gseKEGG. Values for the directional expression distribution (x-axis) and Benjamini–Hochberg adjusted p-value (p.adjust) are represented. E GSEA plots of selected KEGG pathways representing the enrichment scores for the respective gene sets and the positions of genes within the gene set in the ranked DEG list ordered by descending logFC. F Results of ChEA3 TFEA analysis showing the top 15 transcription factors in the Global GTEx TF Network (left), the local network (right), and the top 15 TFs ranked by mean rank score (lower). The filtered EOC2 DEG list (FDR < 0.05, ± logFC 0.6) was used as input. G The top 5 TFs returned by HOMER TFEA analysis are shown. The filtered EOC2 DEG list (FDR < 0.05, ± logFC 0.6) was used as input with all features that returned at least 3 counts per million (cpm) across 4 of the 8 samples with MGI symbols as the background gene list


