Fig. 3.
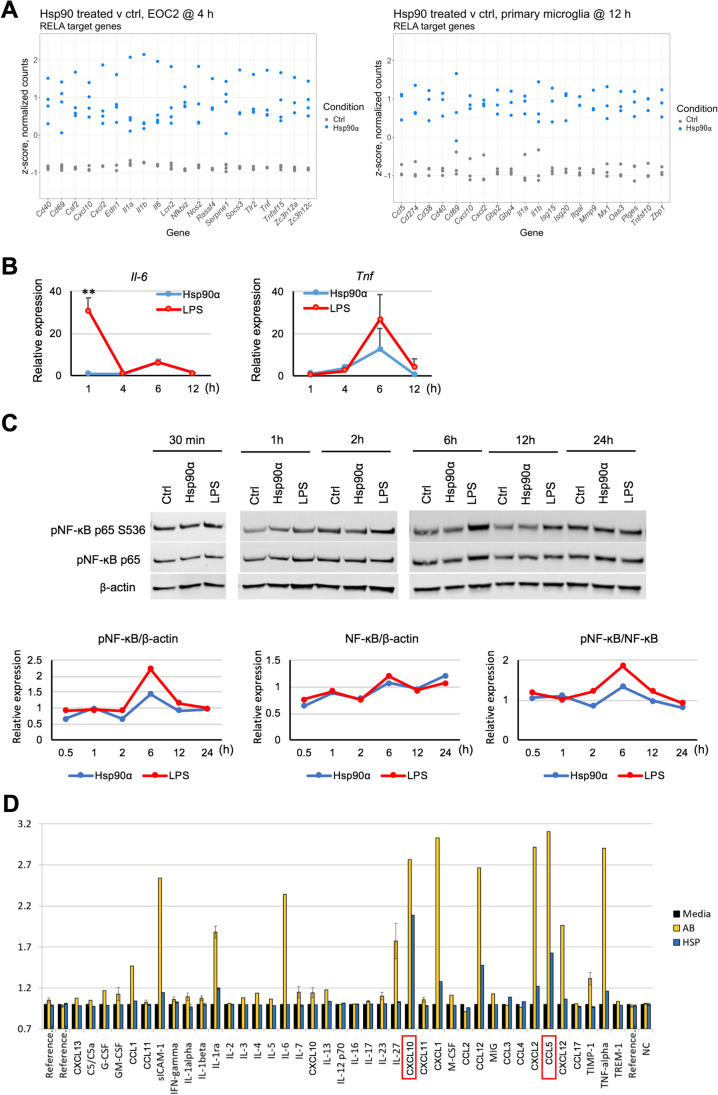
NF-kB target genes are induced in response to eHsp90α, with limited NF-KB activation compared to LPS. A Relative levels of mRNAs in EOC2 cells and primary microglia treated with or without 10 µg/ml Hsp90α for 4 h or 12 h, respectively, that were found to be differentially expressed and that have been identified as NF-κB p65 (RELA) regulatory targets within the curated datasets of the Chea3 TFEA software. The top 10 genes ranked by absolute logFC are shown. B BV2 were cultured in 2% FBS media and treated with Hsp90α (10 μg/ml) or LPS (1000 ng/ml) for 1, 4, 6, and 12 h at which time RNA was isolated and quantified by qPCR for the indicated mRNAs. Gene expression is shown relative to Actb and normalized to control untreated RNA samples collected at the same time points. Control samples were treated with an equimolar concentration of His-tagged protein buffer sourced from the same vendor as the His-tagged Hsp90α. C Under the same culture and treatment conditions as (B), BV2 cells were lysed with RIPA buffer at 30 min, 1, 2, 6, 12, and 24-h post-treatment and cell lysates were analyzed by western blot. Quantitative analyses of immunoblots for p-NF-κB p65 S536, NF-κB p65 are shown with p-NF-κB p65 S536 normalized to total p-NF-κB p65 levels and p-NF-κB p65 levels normalized to β-actin. Each expression ratio was normalized to control untreated samples collected at the same time points. D Cytokines released from primary microglia treated with Hsp90α (10 µg/ml) or fAβ (2 µM) were quantified after 12-h treatment using proteome profiler mouse cytokine array kit, according to manufacturer’s protocol. Cytokine spots’ image intensities are normalized to cytokine levels in culture media of untreated samples (normalized to 1)

