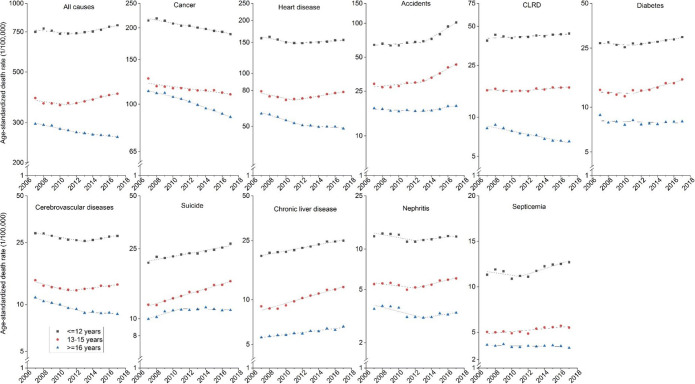
Fig. 1.
Trends in death rates by cause of death and educational attainment, ages 25–74 years, 2007–2017. Note: Rates were age-standardized to the 2000 US standard population and expressed per 100,000 person-years. Dots in graphs are observed rates and lines are fitted rates based on joinpoint analysis. CLRD denotes chronic lower respiratory diseases. Chronic liver disease denotes chronic liver disease and cirrhosis. Nephritis denotes nephritis, nephrotic syndrome, and nephrosis.

