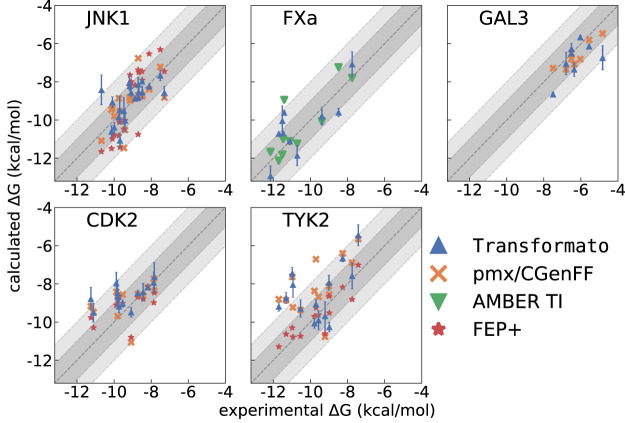
FIGURE 3.
ΔG bind calculated with transformato (blue triangles) compared to results obtained by pmx/CGenFF (for JNK1, GAL3, CDK2, TYK2) marked as orange crosses, by FEP+ (for JNK1, CDK2, TYK2) marked as red stars, and by AMBER (FXa) marked as green triangles. The respective RMSE and MAE values are listed in Table 2.

